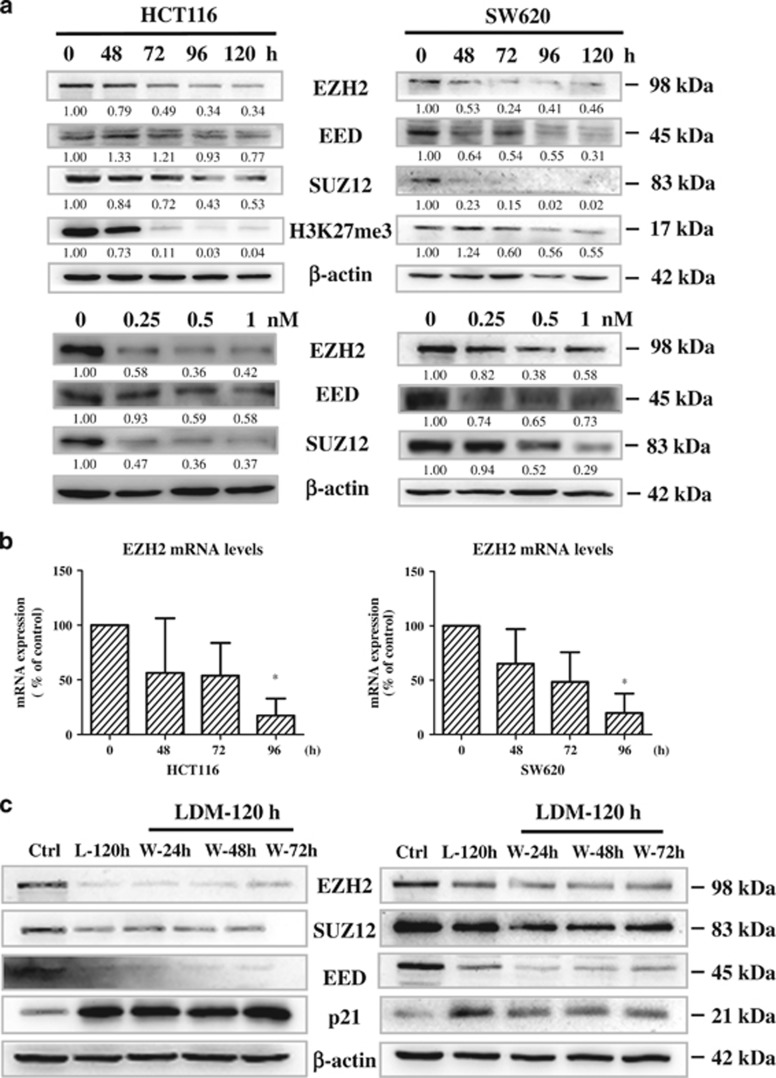
Figure 4.
LDM reduced the expression levels of EZH2 family members. (a) Time- and dose-dependent effect of LDM in HCT116 and SW620 cells. The cells were treated with 0.5 nM LDM for the indicated time or 72 h at the indicated doses. β-Actin served as loading control. The relative optical density for each band was quantified, normalized and labeled under each lane. (b) The cells were treated with 0.5 nM LDM as indicated, harvested and subjected to qRT-PCR analysis. The data were expressed as the means±S.D. of four independent experiments. *P<0.05 versus control. (c) The cells were treated with 0.5 nM LDM for 24, 48 and 72 h, followed by washing with PBS and culture in drug-free medium until 120 h (labeled as W-24 h, W-48 h, W-72 h, respectively), and then harvested and subjected to IB analysis. Long exposure to LDM for 120 h without washing was labeled as L-120 h and loaded simultaneously

