Figure 2.
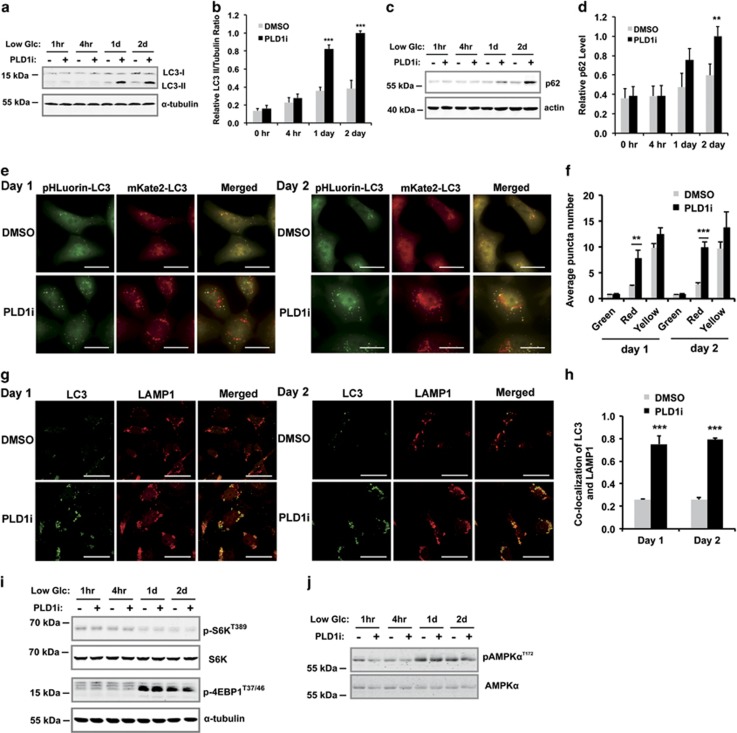
PLD1 inhibition reduces autophagic flux without affecting initiation. (a) PLD1i treatment increased the levels of LC3-II and p62 in MDA-MB-231 cells cultured in low glucose medium (1 mM). Cells were treated with or without PLD1i for the indicated time period. Total cell lysates were analyzed by western blotting for the indicated proteins. (b) Quantification of the ratio of LC3-II and the loading control, α-tubulin, using ImageJ; n=3. (c) PLD1i treatment increased the levels of p62 in MDA-MB-231 cells cultured in low glucose medium. Cells were treated with or without PLD1i for the indicated time period. Total cell lysates were analyzed by western blotting for the indicated proteins. (d) Quantification of p62 levels using ImageJ, and normalized to the loading control, actin; n=3. (e) MDA-MB-231 cells stably expressing pHluorin-mKate2-LC3 were cultured in low glucose medium and treated with DMSO (control) or PLD1i (5 μM) for 1 (left) and 2 days (right) before images for pHluorin and mKate2 fluorescence were taken (scale bar: 20 μm). (f) Quantification of green (pHluorin) and red (mKate2) and yellow (both pHluorin and mKate2) puncta per cell in merged pictures. At least 20 cells were quantified in each experiment; n=3. (g) MDA-MB-231 cells cultured in low glucose medium were treated with DMSO or PLD1i for 1 (left) and 2 days (right) before immunostaining performed for LC3 (green) and LAMP1 (red) (scale bar: 20 μm). Cells were permeabilized with Triton X-100. (h) Quantification of colocalization between LC3 and LAMP1; n=3. (i) PLD1i treatment did not change mTOR activity as assessed by the phosphorylation of p70S6K and 4E-BP1. Note the low glucose culture increased phosphorylation of 4E-BP1 on day 1 and day 2, but PLD1i did not alter this effect. (j) PLD1i treatment did not change AMPK activity as assessed by the phosphorylation of AMPKα. **P<0.01; ***P<0.001

