Figure 2.
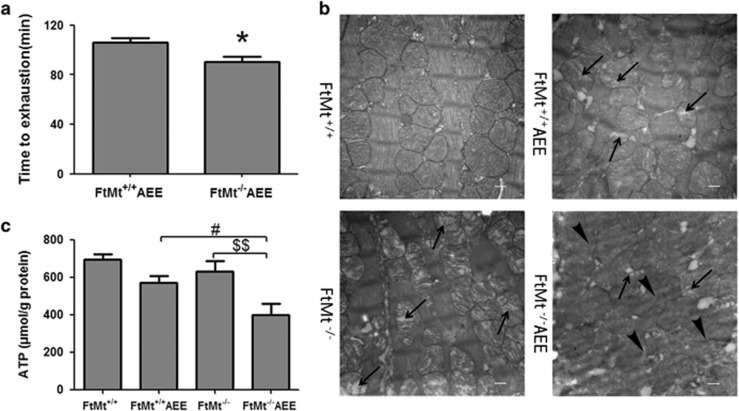
The role of FtMt in time of AEE and morphology, and function of mouse heart. (a) The statistics of exhaustive time in FtMt+/+AEE and FtMt−/−AEE mice. Values are presented as the mean±S.D. *P<0.05 versus FtMt+/+AEE group. n=6. (b) Transmission electron microphotographs exhibiting the heart morphology after AEE. Arrows indicate damage/absence of cristae; arrowheads indicate fibril disarrangement. The picture is magnified 20 × 103 times, scale bars=500 nm. Three animals for each group and three sections for each sample were examined, and representative images are shown. (c) ATP is downregulated in FtMt+/+and FtMt−/− after AEE. Values are presented as the mean±S.D. #P<0.05 versus FtMt+/+AEE group, $$P<0.01 versus FtMt−/− group. n=4

