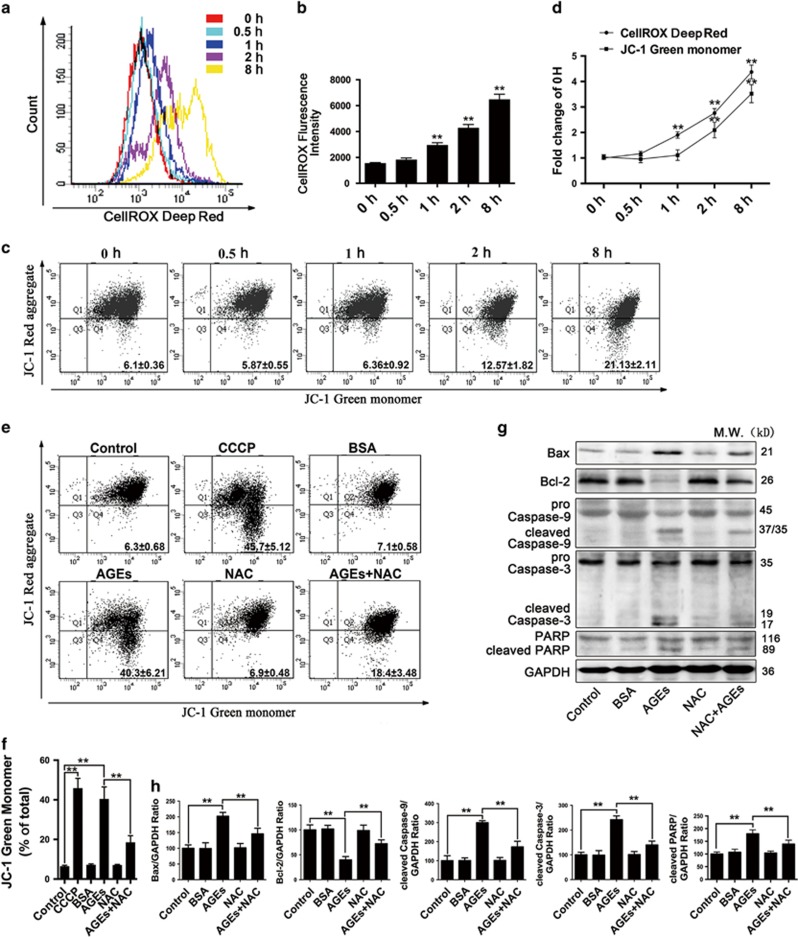
Figure 2.
AGEs caused ROS-mediated mitochondrial depolarization and led to mitochondrial-dependent apoptosis in mesangial cells. (a–d) Cells were treated with AGEs (250 mg/l) for 0, 0.5, 1, 2 and 8 h. (a) The ROS levels were assessed by determining CellROX Deep Red fluorescence intensity via flow cytometry. (b) Quantitative analysis of fluorescence intensity. The data are presented as the mean±S.E.M. from at least three independent experiments. **P<0.01 versus 0 h. (c) The level of MMP was determined by flow cytometric analysis of the JC-1 dye. The numbers in each quadrant represent the green (monomer) fluorescence ratio. The data are presented as the mean±S.E.M. from at least three independent experiments. (d) Time-kinetics analysis of (a) and (b). The data are presented as the mean±S.E.M. from at least three independent experiments. **P<0.01 versus 0 h. (e–h) Cells were pre-treated with or without NAC (5 mM) and then incubated with AGEs (250 mg/l) for 24 h. (e) The level of MMP was determined by flow cytometric analysis of the JC-1 dye. CCCP, a mitochondrial membrane potential disrupter, was used as a positive control. The numbers in each quadrant represent the green (monomer) fluorescence ratio. The data are presented as the mean±S.E.M. from at least three independent experiments. (f) Quantification of JC-1 green fluorescence. The data are presented as the mean±S.E.M. from at least three independent experiments. **P<0.01. (g) Western blot analysis of Bax, Bcl-2, Caspase-9, Caspase-3 and PARP expression in each group. (h) Quantitative analysis of Bax, Bcl-2, cleaved Caspase-9, cleaved Caspase-3 and cleaved PARP protein expression. The data are presented as the mean±S.E.M. from at least three independent experiments. **P<0.01

