Figure 4.
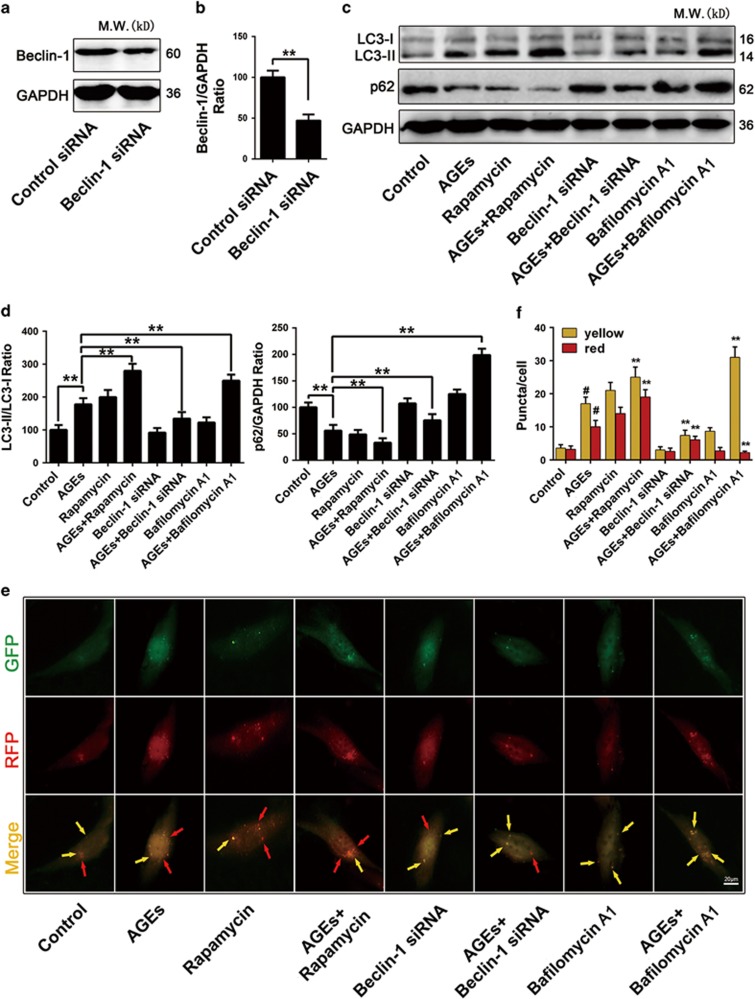
Autophagy flux measurements in AGE-treated mesangial cells. (a) Western blot analysis of Beclin-1 protein levels in mesangial cells that were transiently transfected with control siRNA or Beclin-1 siRNA for 24 h. (b) Quantitative analysis of Beclin-1 protein expression. The data are presented as the mean±S.E.M. from at least three independent experiments. **P<0.01. (c) Western blot analysis of LC3II/LC3I and p62 protein levels in mesangial cells treated with or without Rapamycin (100 nM), Bafilomycin A1 (10 nM) or Beclin-1 siRNA and incubated with or without AGEs (250 mg/l) for 24 h. (d) Quantitative analysis of LC3II/LC3I and p62 protein expression. The data are presented as the mean±S.E.M. from at least three independent experiments. **P<0.01. (e) Mesangial cells were transiently transfected with the GFP-RFP-LC3 plasmid for 24 h and then further treated with or without Rapamycin (100 nM), Bafilomycin A1 (10 nM) or Beclin-1 siRNA and incubated with AGEs (250 mg/l) for 24 h. Arrowheads: yellow puncta (RFP+/GFP+-LC3 puncta), red puncta (RFP+/GFP−-LC3 puncta). Bar=2 μm. (f) The yellow and red puncta were quantified (>20 cells were counted in each experiment, and at least three independent experiments were performed). The data are presented as the mean±S.E.M. #P<0.01 versus control, **P<0.01 versus AGE-treated cells

