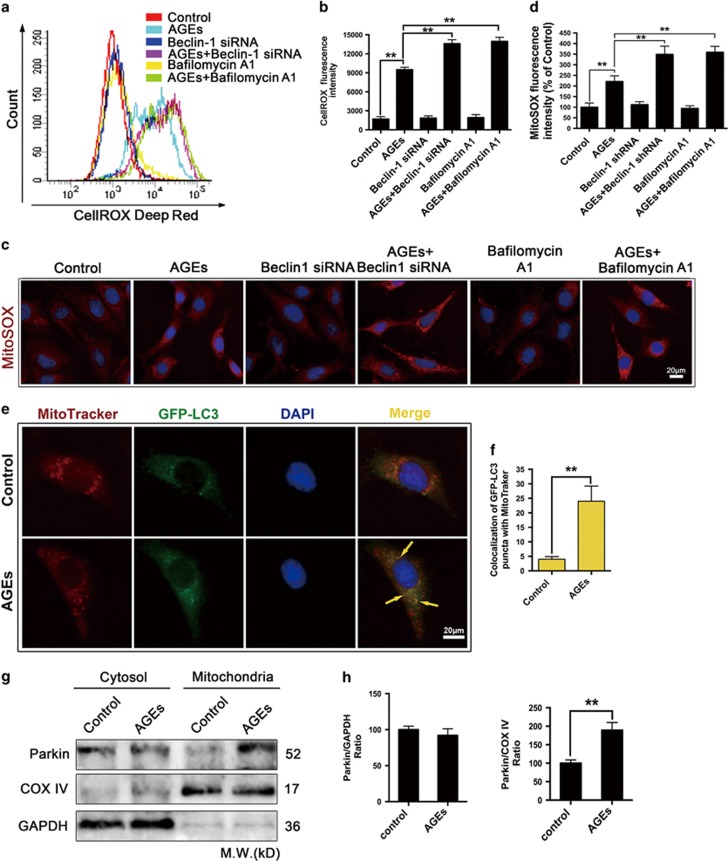
Figure 6.
AGEs triggered autophagic clearance of ROS. (a–d) Cells were pre-treated with or without Beclin-1 siRNA and Bafilomycin A1 (10 nM) and then incubated with AGEs (250 mg/l) for 24 h. (a) The ROS levels were assessed by determining CellROX Deep Red fluorescence intensity via flow cytometry. (b) Quantitative analysis of the fluorescence intensity. The data are presented as the mean±S.E.M. from at least three independent experiments. **P<0.01. (c) Mitochondrial superoxide accumulation was determined by measuring the MitoSOX Red fluorescent intensity. Bar=2 μm. (d) Quantitative analysis of the mean MitoSOX Red fluorescence (>20 cells were imaged in each experiment, and at least three independent experiments were performed). The data are presented as the mean±S.E.M. **P<0.01. (e–h) Cells were treated with AGEs (250 mg/l) for 24 H. (e) Immunofluorescence analysis was used to determine the number of GFP-LC3-positive autophagosomes that colocalized with MitoTracker-labeled mitochondria. Arrowhead: yellow arrows indicate colocalization. Bar=2 μm. (f) Quantitative analysis of GFP-LC3/MitoTracker colocalization as an index of mitophagy (>20 cells were imaged in each experiment, and at least three independent experiments were performed). The data are presented as the mean±S.E.M. **P<0.01. (g) Cytosolic and mitochondrial fractions were isolated from the cells, and Parkin expression was analyzed by western blotting. GAPDH and COX IV were used as loading controls for the cytosolic and mitochondrial fractions, respectively. (h) Quantitative analysis of Parkin protein expression. The data are presented as the mean±S.E.M. from at least three independent experiments. **P<0.01

