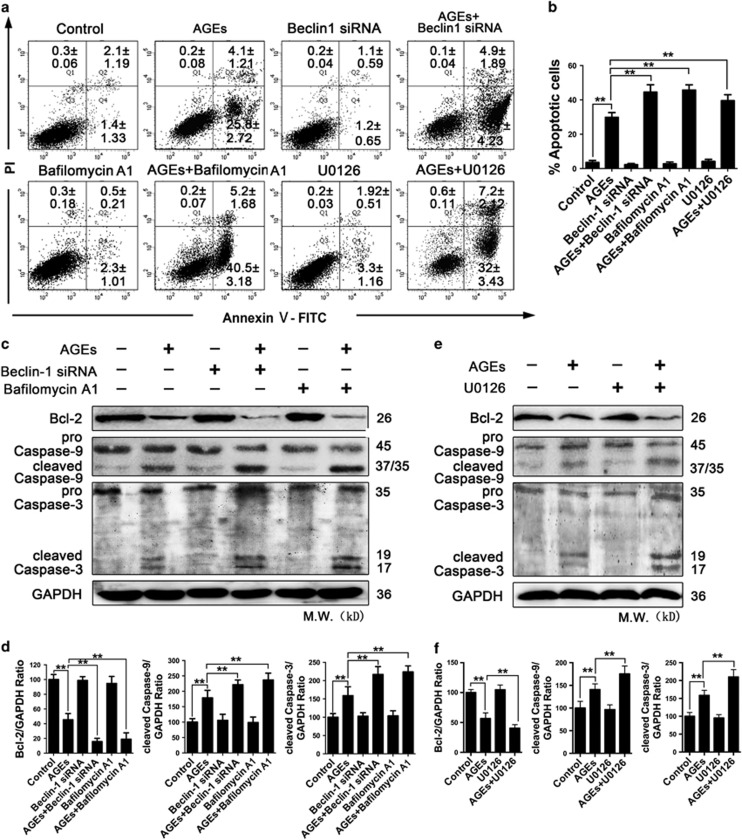
Figure 7.
Inhibition of autophagy aggravated AGE-induced mesangial cell apoptosis. (a–d) Cells were pre-treated with or without Beclin-1 siRNA and Bafilomycin A1 (10 nM) and then incubated with AGEs (250 mg/l) for 24 h. (a) Cell apoptosis was detected using the annexin V-FITC/PI kit. The numbers in each quadrant represent the percentage of cells. The data are presented as the mean±S.E.M. from at least three independent experiments. (b) Percentages of apoptotic cells in each group. The data are presented as the mean±S.E.M. from at least three independent experiments. **P<0.01. (c) Western blot analysis of Bcl-2, Caspase-9 and Caspase-3 expression in each group. (d) Quantitative analysis of Bcl-2, cleaved Caspase-9 and cleaved Caspase-3 protein expression. The data are presented as the mean±S.E.M. from at least three independent experiments. **P<0.01. (e and f) Cells were pre-treated with or without U0126 (30 μM) and incubated with AGEs (250 mg/l) for 24 h. (e) Western blot analysis of Bcl-2, Caspase-9 and Caspase-3 expression in each group. (f) Quantitative analysis of Bcl-2, cleaved Caspase-9 and cleaved Caspase-3 protein expression. The data are presented as the mean±S.E.M. from at least three independent experiments. **P<0.01

