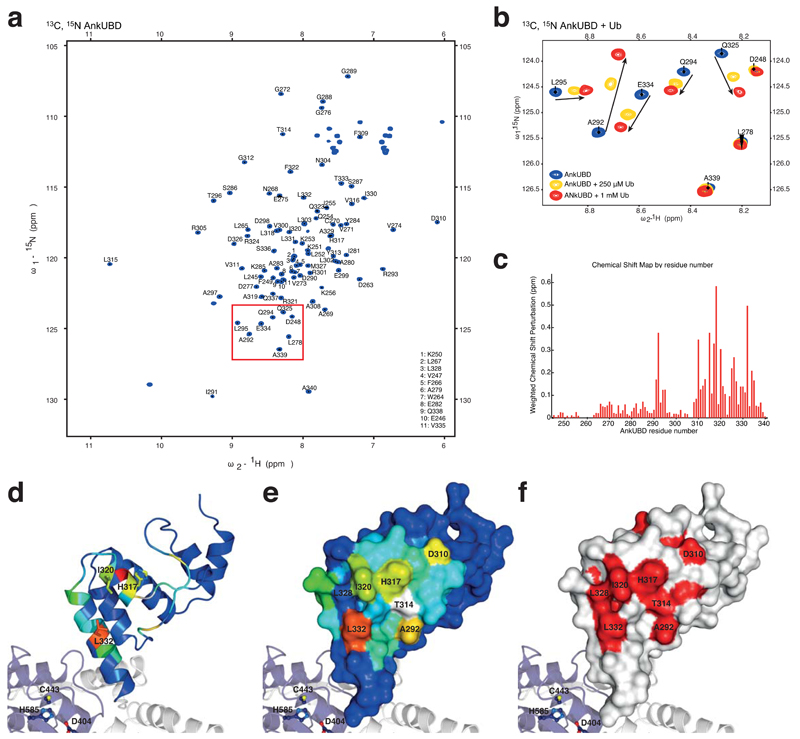
Figure 3.
A conserved hydrophobic surface on AnkUBD binds Ub. (a) 1H,15N-HSQC spectrum of 13C, 15N-labelled TRABID Ank domain. (b) Close-up of a region boxed in a, showing resonances of the doubly labeled Ank domain (blue) and their shifts upon addition of 250 μM (yellow) or 1 mM (red) unlabeled Ub. Arrows indicate the shift of individual resonances. (c) Weighted chemical shift perturbation map of the AnkUBD binding to Ub. (d) AnkUBD residues are colored according to the degree of perturbation from blue (unperturbed) to red (strongly perturbed) and key residues are shown in stick representation. (e) The AnkUBD surface is shown colored as in d and key residues are labeled. (f) Invariant residues derived from a species sequence alignment (Supplementary Fig. 2b) are shown in red on a white AnkUBD surface.

