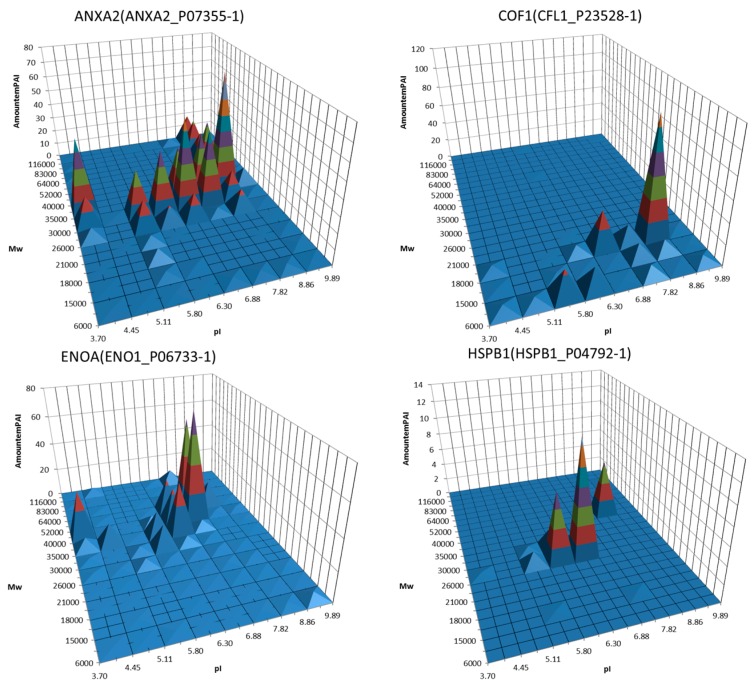
Figure 2.
Examples of 3D graphs showing distribution of proteoforms between different sections of the 2DE map. A semi quantitative (estimated by emPAI) distribution of the same protein (gene) around the different gel sections was plotted. Proteins, the potential biomarkers, are shown. Adapted from [90].


