Figure 1.
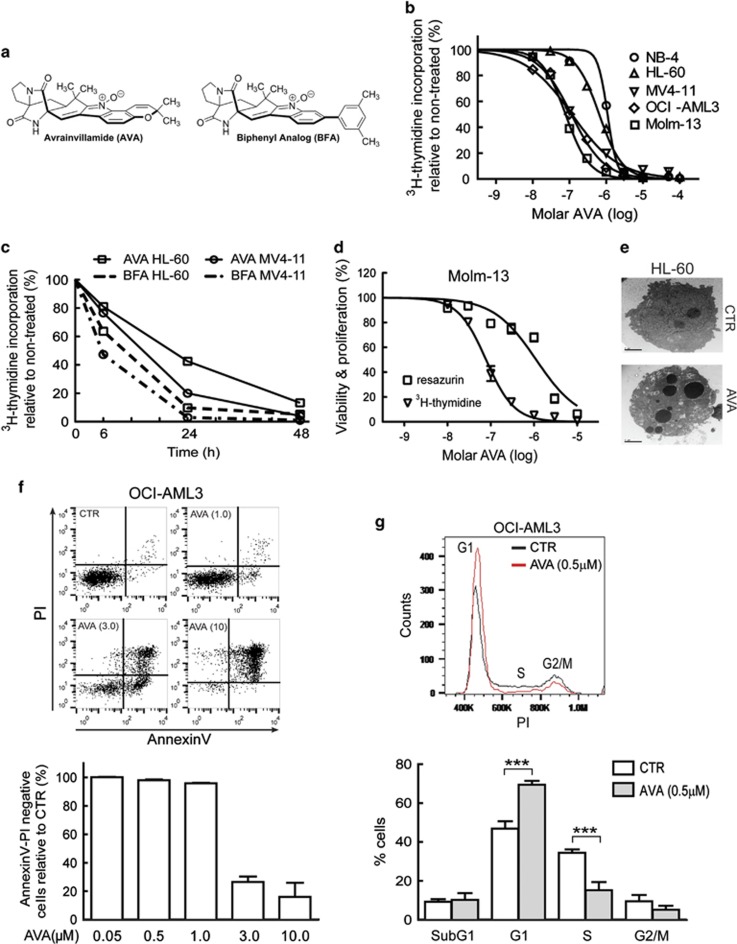
Effects of avrainvillamide on AML cell lines. (a) Structure of avrainvillamide (AVA) and AVA biphenyl analog (BFA). (b) NB4, HL-60, MV4-11, OCI-AML3 and Molm-13 cells were incubated with AVA (10 nM–30 μM) for 24 h, (n=3–7), and proliferation was determined by 3H-thymidine incorporation. For all cell proliferation experiments, cells were incubated with 3H-thymidine for 6 h immediately before scintillation counting. Results represent the mean±S.E.M. of the values relative to vehicle controls. (c) HL-60 and MV4-11 cells were treated for 6, 24 or 48 h with 1 μM AVA or its BFA (n=3–4), then proliferation was determined by 3H-thymidine incorporation. (d) Molm-13 cells were treated with varying concentrations of AVA (10 nM–30 μM) for 24 h. The cells were either incubated with 3H-thymidine or resazurin for the final 4 h before scintillation counting or assessment of fluorescence emission, respectively. Results indicate the mean of the values relative to vehicle controls (n=3–4). Triangles and squares represent measured rates of proliferation and metabolic activity, respectively. (e) HL-60 cells were treated with DMSO (CTR) or 3 μM AVA for 24 h and examined by transmission electron microscopy (scale bar, 2 μm). (f) Histogram displayed for OCI-AML3 cells treated with DMSO (CTR) or 1.0, 3.0 and 10 μM AVA for 24 h, stained with annexinV and propidium (PI) and analyzed by flow cytometry. AnnexinV/PI-negative cells are graphed as live cells normalized to CTR for all concentrations of AVA mean±S.D. (n=3). (g) Cell cycle analyses of OCI-AML3 cells treated for 24 h with 0.5 μM AVA following fixation, PI staining and flow cytometry analysis. Representative histogram with G1, S and G2/M is shown and the subG1, G1, S and G2/M phases are graphed using mean±S.D. (n = 5, ***P<0.001). For all flow cytometric analyses least 10 000 events per sample were acquired

