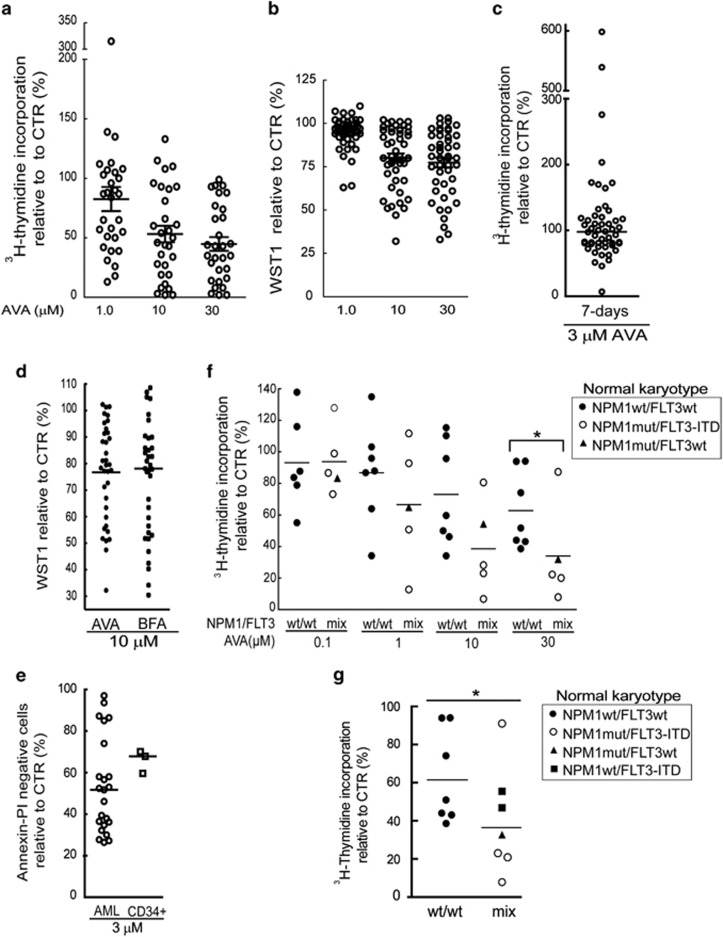
Figure 2.
Effects of avrainvillamide on primary AML patient cells. Primary AML cells were incubated with avrainvillamide (AVA; 10 nM–300 μM) for 24 h and proliferation assayed by (a) 3H-thymidine incorporation or (b) metabolic activity determined by the WST-1 assay. Results are shown for 1.0, 10 and 30 μM AVA treatment. (c) Primary AML cells were incubated with a cytokine cocktail (FLT3 ligand, SCF and GM-CSF) containing DMSO or AVA (3 μM) for 7 days. Proliferation was assayed by 3H-thymidine incorporation. Circles represent the mean values relative to vehicle controls; horizontal bar indicates the median of all 52 values. (d) Primary cells from 35 AML patients were treated with AVA or BFA (10 μM) for 24 h. Dots or squares represent the mean values relative to vehicle controls compared with untreated controls. Horizontal bars represent the median values. (e) Primary cells from 23 AML patients and three umbilical cord CD34+ blood samples were treated with AVA (3 μM) for 24 h. Cells were stained with annexinV/PI and analyzed by flow cytometry. Circles represent the mean values relative to vehicle controls. Horizontal bars indicate the median values. (f) Primary AML cells with normal karyotype and either wild-type NPM1 (wt, n=7) or mutated NPM1 (mut, n=5) were treated with AVA (0.1, 1.0, 10 and 30 μM) for 24 h and assayed by 3H-thymidine incorporation. Symbols represent the mean values relative to vehicle controls. Wt NPM1, wt FLT3 (●), mutant NPM1, FLT3–ITD (○) and mutant NPM1, wt FLT3(▴). Horizontal bars represent the median values (*P<0.05). (g) The same patient samples from f, including two additional FLT3–ITD, wt NPM1 AML patient samples (▪) were incubated with 30 μM AVA and assayed by 3H-thymidine incorporation. Wt NPM1, wt FLT3 (▴), mutant NPM1, FLT3–ITD (○) and mutant NPM1, wt FLT3(▴). Horizontal bars represent the median values (*P<0.05)

