Figure 7.
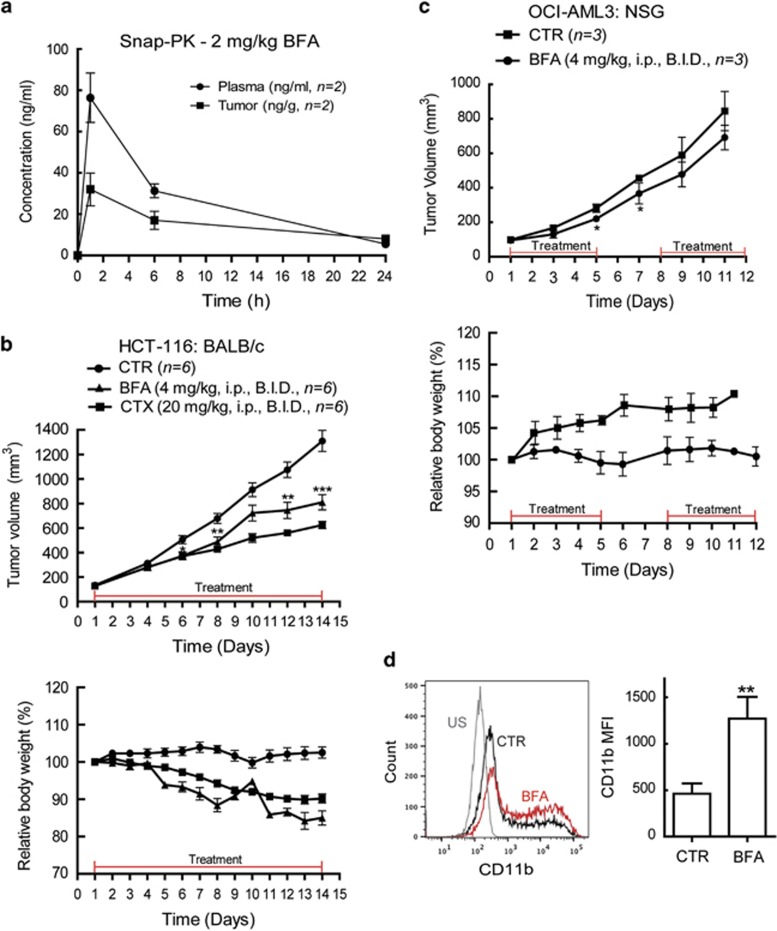
BFA treatment reduces the tumor growth in xenograft mouse models. (a) Snap-PK for 2 mg/kg BFA concentration (ng/ml) in plasma and tumor of BALB/c nude mice implanted subcutaneously with HCT-116 cells (n=2) measured after 1, 6 and 24 h. (b) BALB/c nude mice xenografted subcutaneously with HCT-116 cells were treated BID i.p., when tumor sizes reached ~100 mm3 with vehicle control (n=6), BFA 4 mg/kg (n=6) or CTX 20 mg/kg (n=6) as indicated for 14 days. The tumor sizes were measured and relative weight change (%) calculated. Comparisons (mean±S.E.M.) between tumors from treated and control mice were conducted using an unpaired Student's t-test (*P<0.05, **P<0.01). (c) NSG mice xenografted subcutaneously with OCI-AML3 cells were treated BID i.p., when tumor sizes reached ~100 mm3 with vehicle control (n=3) or BFA 4 mg/kg (n=3), as indicated and the tumor sizes were measured and relative weight change (%) calculated. Comparisons (mean±S.E.M.) between tumors from treated and control mice were conducted using an unpaired Student's t-test (*P<0.05). (d) Live tumor-derived cells were stained and analyzed by flow cytometry for CD11b expression (median fluorescence intensity (MFI)) by gating on living cells (PI or TO-PROIII negative). Representative histogram is shown at the left. Fold changes (mean±S.D.) relative to controls (CTR) are shown (n=3 tumors). Comparisons between control and treated tumor-derived cells were conducted using an unpaired Student's t-test (**P<0.01). US, unstained

