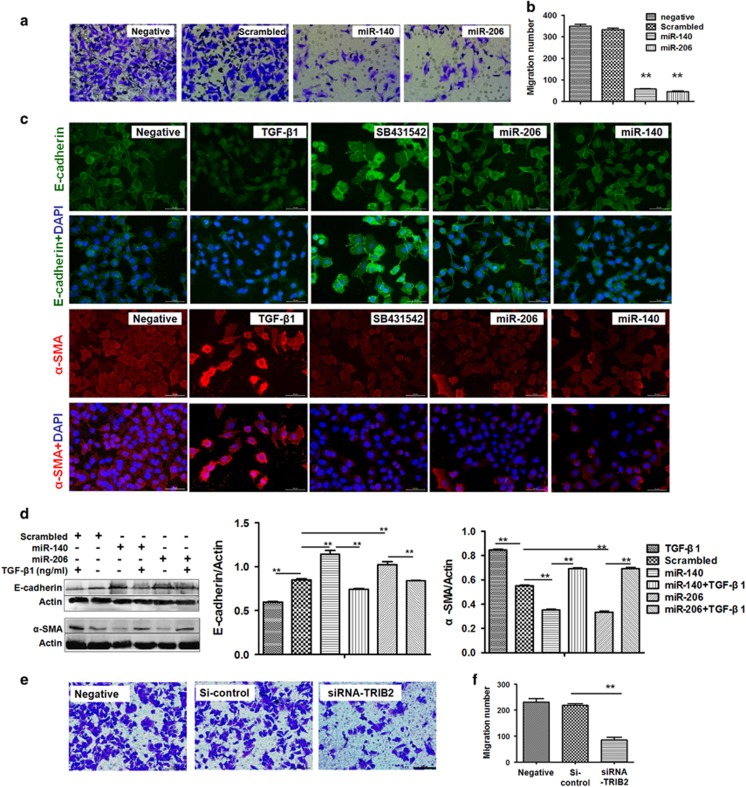
Figure 5.
MiR-206 and miR-140 inhibited cell metastasis. (a and b) Cell metastasis analysis. Fewer A549 cells migrated to the lower chambers in miR-206- or miR-140-treated cultures compared with NC treatment. **P<0.01, miR-206 or miR-140 treatment versus scrambled control. (c) Immunofluorescence and (d) western blot. E-cadherin expression increased, whereas α-SMA decreased in miR-206- (or miR-140)-treated A549 cells, similar to data from SB431542 treatment. Relative values for E-cadherin or α-SMA versus actin are indicated to the right of the gels. **P<0.01, miR-206 treatment versus scrambled control. P<0.05, miR-140 treatment versus scrambled control. MiR-206 or miR-140, cells treated with miR-206 or miR-140 oligos. SiRNA-Smad3 or SiRNA-control, cells treated with small interfering RNA specific to Smad3 or siRNA-control. TGF-β1 and SB431542, cells treated with TGF-β1 (10 ng/ml) and SB431542 (5 μmol/ml) for 24 h. Bar=50 μM. (e and f) Cell metastasis analysis. Fewer A549 cells migrated to the lower chambers in siRNA-TRIB2—treated cells compared with siRNA control treatment. **P<0.01 siRNA treatment versus siRNA control

