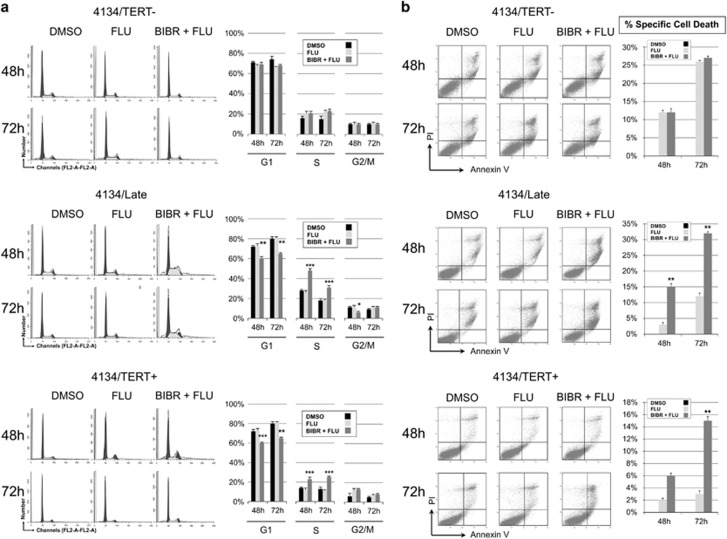
Figure 7.
Effects of FLU and BIBR+FLU treatments on cell cycle profiles and cell viability in LCLs. Cells were treated with FLU (5 μM) and BIBR (30 μM) plus FLU (5 μM) (BIBR+FLU) and analyzed at 48 and 72 h. DMSO was used as control. (a) Cells were labeled with PI and analyzed by flow cytometry. Panels from one representative experiment are shown. Graphs on right: percentages of cells in G1-, S- and G2/M-phase. Values are means and S.D. (bar) of three independent experiments. (b) Cells were labeled with annexin V/PI and analyzed by flow cytometry. Panels from one representative experiment are shown. Graphs on right: percentages of specific cell death. Values are means and S.D. (bar) of three separate experiments. Significant differences between values in BIBR+FLU-treated versus FLU-treated cells are shown: *P<0.05, **P<0.01 and ***P<0.001

