Figure 1.
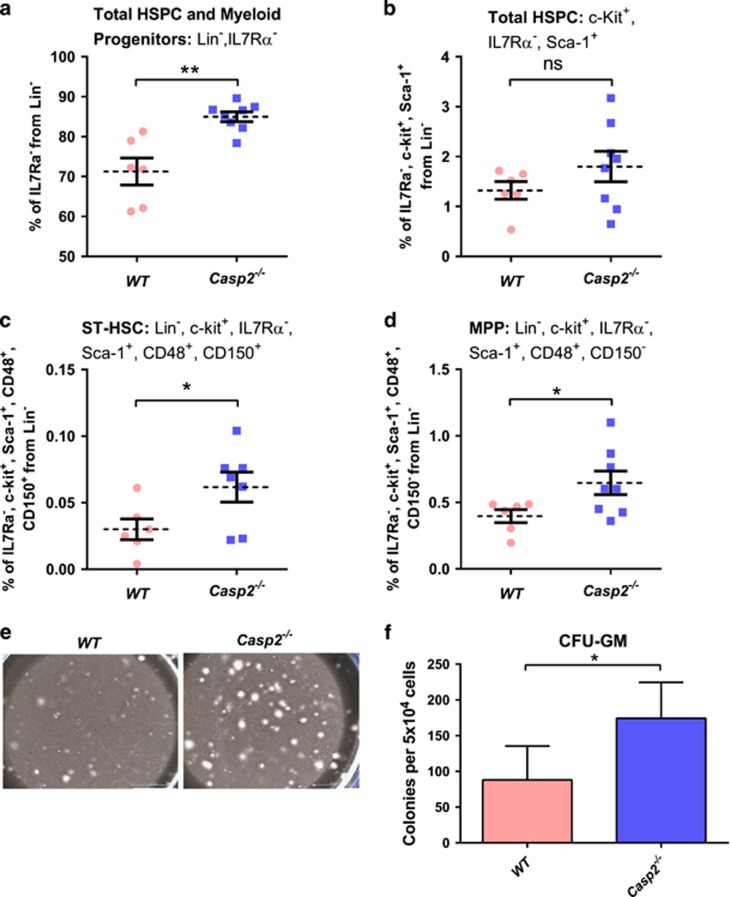
Functional characterization of HSPCs in Casp2−/− mice. (a) HSPC and myeloid progenitor cells from Lin−, IL7Rα− bone marrow cells quantitated by flow cytometry. Results were obtained from WT (n=6) and Casp2−/− (n=8) mice at 24 months. Data represented as mean±S.E.M., **P<0.01. (b) The percentage of total HSPC cells from c-Kit+, IL7Rα−, Sca-1+ population in the bone marrow from 24-month-old mice followed by (c) ST-HSC and (d) MPP. Results were obtained from WT (n=6) and Casp2−/− (n=8) mice at 24 months. Data represented as mean±S.E.M. P-values are indicated as either non-significant (ns) or *P<0.05. (e) LTC-IC assay. Representative image of colonies obtained from 5 weeks of culture of BM cells from WT and Casp2−/− mice. Scale bar=50 μM. (f) Quantitation of colonies obtained from LTC-IC assay for WT (n=4) and Casp2−/− (n=4) mice at 24 months. Data represented as mean±S.E.M. *P<0.05

