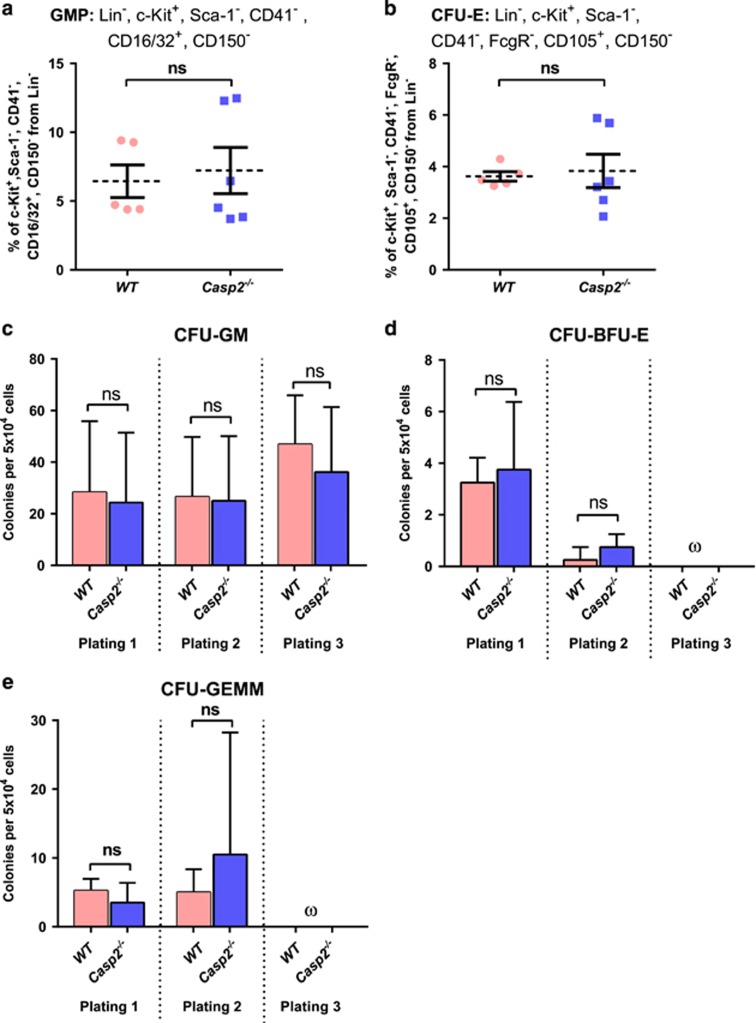
Figure 4.
Characterization of myeloid progenitor cells in young Casp2−/− mice. The percentage of (a) GMP and (b) CFU-E in the BM quantitated by flow cytometry. Results were obtained from WT (n=5) and Casp2−/−(n=6) mice. Data represented as mean±S.E.M. P-values are indicated as non-significant (ns). (c–e) Quantitation of myelo-erythroid progenitor self-renewal from BM using serial colony-forming assay. Colonies scored for CFU-GM (c), CFU-BFU-E (d) and CFU-GEMM (e) obtained from WT (n=5) and Casp2−/−(n=6) mice. Data represented as mean±S.E.M. P-values are indicated as ns. The symbol ‘ω' denotes that no colonies were formed

