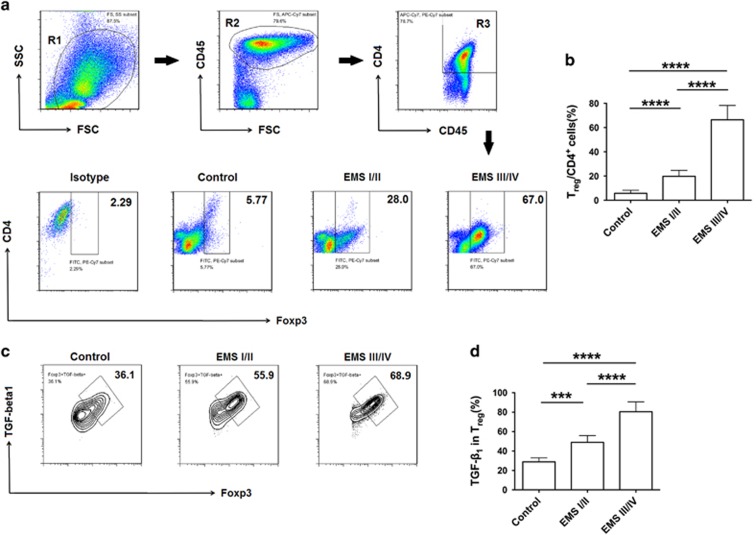
Figure 1.
Percentage of Treg cells in peritoneal fluid increases as endometriosis progresses. (a) Complete gating strategy for peritoneal Treg cells. Gate R2 is inclusive of gate R1; cells of gate R2 represent CD45+ cells. Gate R3 is inclusive of gate R2; cells of gate R3 represent CD4+CD45+ cells. Peritoneal fluid from a patient with EMS stage III/IV is represented above. Flow cytometric analysis was used to determine the percentage of Treg cells in peritoneal fluid of endometriosis patients in different stages. Numbers in quadrants indicate the percentage of cells. (b) Quantification of the percentage of Treg cells in a. Values indicate mean±S.D., n (Control)=6, n (EMS stage I/II)=6, n (EMS stage III/IV)=6, ****P<0.0001, two-tailed, unpaired t-test. (c) Flow cytometric analysis was used to determine the expression of TGF- β1 in peritoneal Treg cells of endometriosis patients in different stages. Numbers in quadrants indicate the percentage of cells. (d) Quantification of TGF-β1 expression of Treg cells in c. Values indicate mean±S.D., n (Control)=6, n (EMS stage I/II)=6, n (EMS stage III/IV)=6, ***P<0.001, ****P<0.0001, two-tailed, unpaired t-test. EMS I/II, stage I and II of endometriosis; EMS III/IV, stage III and IV of endometriosis

