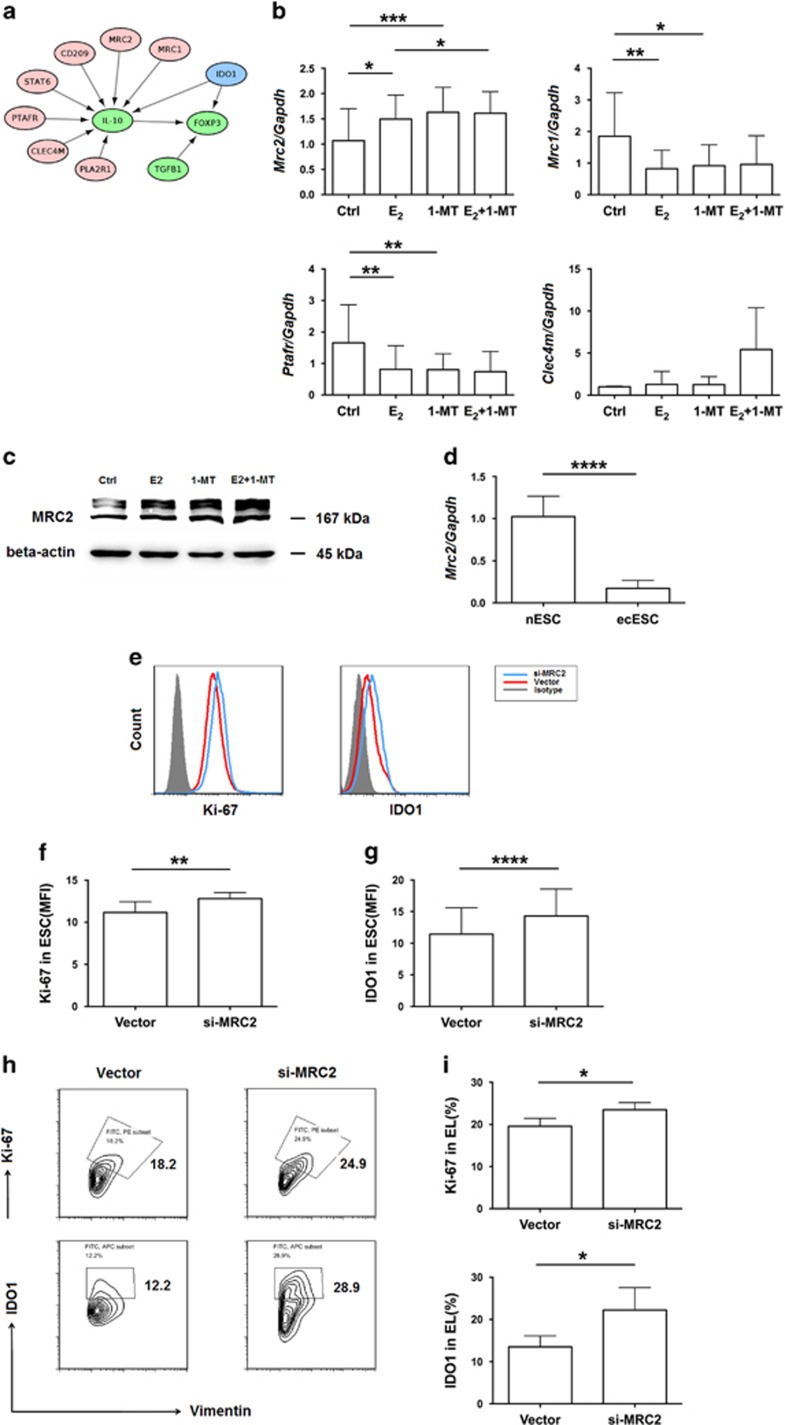
Figure 5.
MRC2 is a downstream molecule of IDO1 and negatively regulates IDO1 expression. (a) Interactions of IDO1, IL-10, TGF-β1, and Foxp3. (b) mRNA expression of MRC2 (n=13), MRC1 (n=9), PTAFR (n=9), CLEC4M (n=6) in ESCs (Ctrl group), estrogen-treated ESCs (E2 group), 1-MT-treated ESCs (1-MT group), and estrogen plus 1-MT-treated ESCs (E2+1-MT group) was determined. Values indicate mean±S.D., *P<0.05, **P<0.01, ***P<0.001, two-tailed, paired t-test. (c) Protein expression of MRC2 shown in (b) analyzed by western blot. (d) mRNA expression of MRC2 in normal ESCs (nESC, n=9) and ectopic ESCs (ecESC, n=15). Values indicate mean±S.D., ****P<0.0001, two-tailed, unpaired t-test. (e) Flow cytometric analysis was used to determine the expression of IDO1 and Ki-67 in MRC2-silenced (si-MRC2) ESCs and ESCs of vector group. (f, g) MFI of the expression of IDO1 and Ki-67 shown in (e), n=8, **P<0.01, ****P<0.0001, two-tailed, paired t-test. (h) Flow cytometric analysis was used to determine the expression of Ki-67 and IDO1 in ectopic lesions of vector- and MRC2 shRNA-administered groups in vivo. Numbers in quadrants indicate the percentage of cells. (i) Quantification of the expression of Ki-67 and IDO1 in ectopic lesions in (h). Values indicate mean±S.D., n=6, *P<0.05, two-tailed, unpaired t-test

