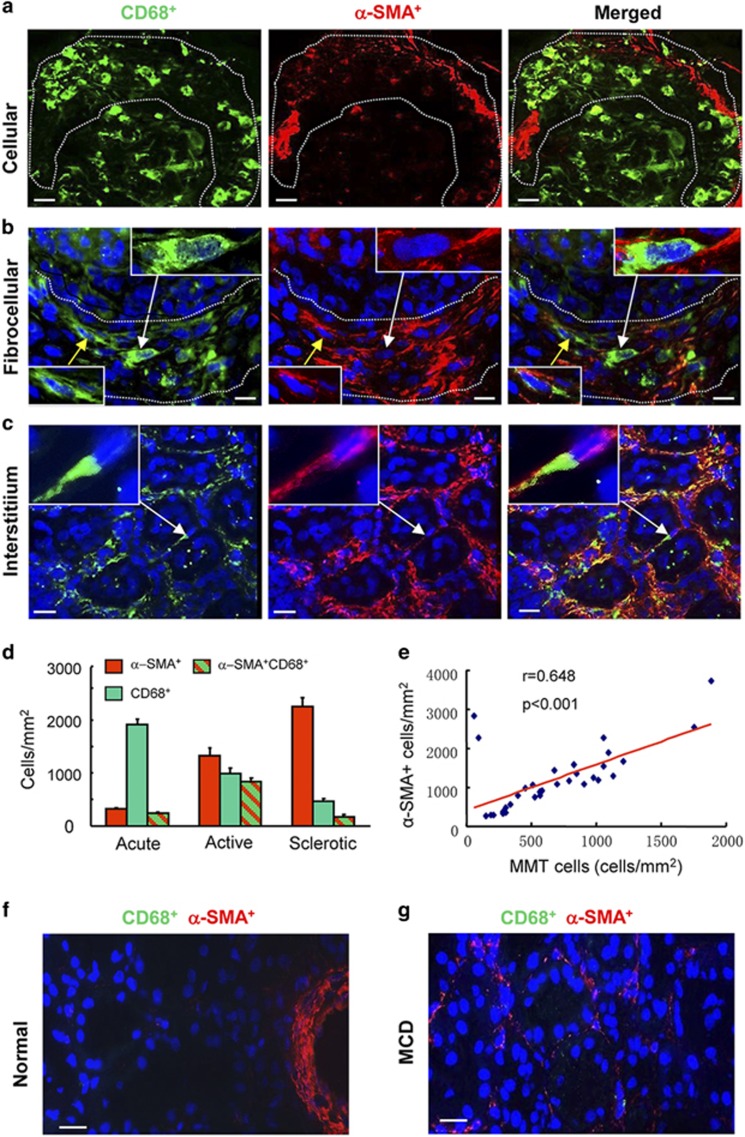
Figure 1.
Evidence of macrophage–myofibroblast transition in human kidney disease. (a) Results of confocal microscopy indicate that CD68+ macrophages (green) and α-SMA+ myofibroblasts (red) are distinct populations in a case of acute glomerular inflammation featuring a cellular crescent (outlined). (b and c) The presence of co-expressing CD68+α-SMA+ cells (arrows and insets) can be seen in a fibrocellular crescent (outlined) (b) and in an area of interstitial fibrosis in a case of IgA nephropathy (c). (d) Quantification of CD68+ macrophages, α-SMA+ myofibroblasts and MMT cells co-expressing both markers (CD68+α-SMA+) in acute inflammation (acute, n=7), active fibrosis (active, n=25) or advanced sclerotic (sclerotic, n=14) lesions. (e) Spearman correlation analysis of the number of CD68+α-SMA+ cells versus total α-SMA+ myofibroblast accumulation from 32 cases of fibrotic kidney disease. (f) Normal human kidney. (g) Minimal change kidney disease (MCD). Nuclei are labeled with DAPI (blue). Scale bar, 20 μM

