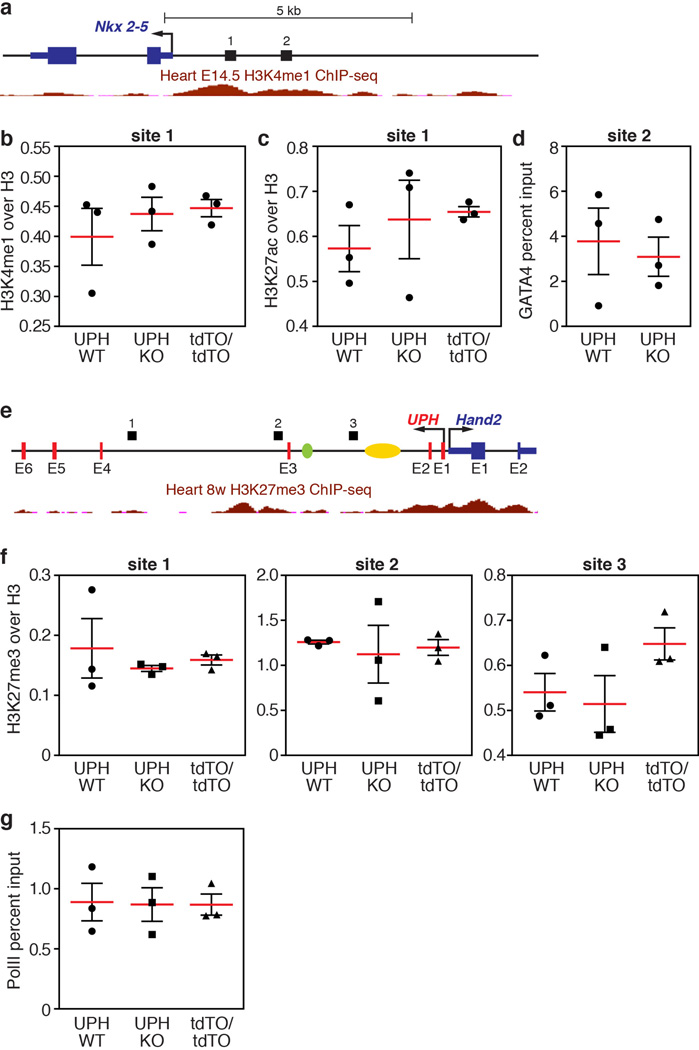
Extended Data Figure 7. ChIP and qPCR analyses of active cardiac enhancers regulating Nkx2-5 expression.
a, Diagram of the Nkx2-5 locus with numbers (1 and 2) indicating the region analysed by qPCR following ChIP. Shown in red are the ENCODE/LICR H3K4me1 active enhancer marks in the heart at E14.5. See Methods for source data. b, ChIP coupled with qPCR analysis of H3K4me1 marks, normalized to total histone H3, showed that the H3K4me1 marks bound to the Nkx2-5 promoter region are unchanged between wild-type, Uph KO and UphtdTO/tdTO homozygous hearts at E10.0. c, ChIP coupled with qPCR analysis of H3K27ac marks, normalized to total histone H3, showed that the H3K27ac marks bound to the Nkx2-5 promoter region are unchanged between wild-type, Uph KO and UphtdTO/tdTO homozygous hearts at E10.0. d, GATA4 binding to a GATA4 site in the Nkx2-5 promoter is unchanged between wild-type and Uph KO hearts at E10.0. e, Diagram of the Uph–Hand2 locus, with black bars indicating the regions analysed by qPCR following ChIP. Shown in red is the ENCODE/LICR H3K27me3 track for mouse heart. See Methods for source data. The branchial arch enhancer (green) and cardiac enhancer (yellow) are shown. f, ChIP coupled with qPCR analysis of the polycomb repressive marker H3K27me3, normalized to total histone H3, showed no differences between genotypes at each locus (1–3) indicated in the diagram in e. g, qPCR revealed no difference in the levels of Ser2-phosphorylated RNAPII between genotypes at the Nkx2-5 gene body. Each point is one of 3 technical replicates of 5 pooled hearts for each genotype in each ChIP experiment, from 1 of 2 independent experiments; mean ± s.e.m.

