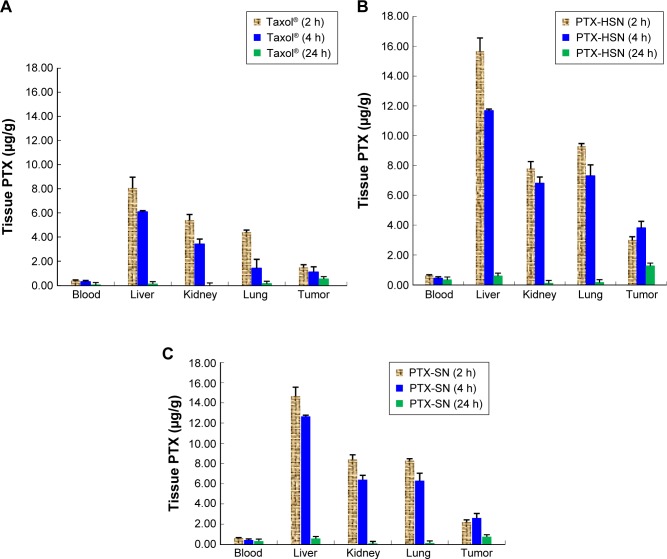
Figure 7.
Mean tissue distribution of PTX in tumor-transplanted CD44-overexpressing SK-OV-3 xenograft mice.
Notes: Distribution at 2, 4, and 24 h following a bolus injection of Taxol® (A), PTX-HSNs (B), or PTX-SNs (C) via the caudal vein. Data are presented as mean values ± SD (n=3).
Abbreviations: PTX-SN, paclitaxel-loaded solid nanoemulsions; PTX-HSN, paclitaxel-loaded hyaluronan solid nanoemulsions.

