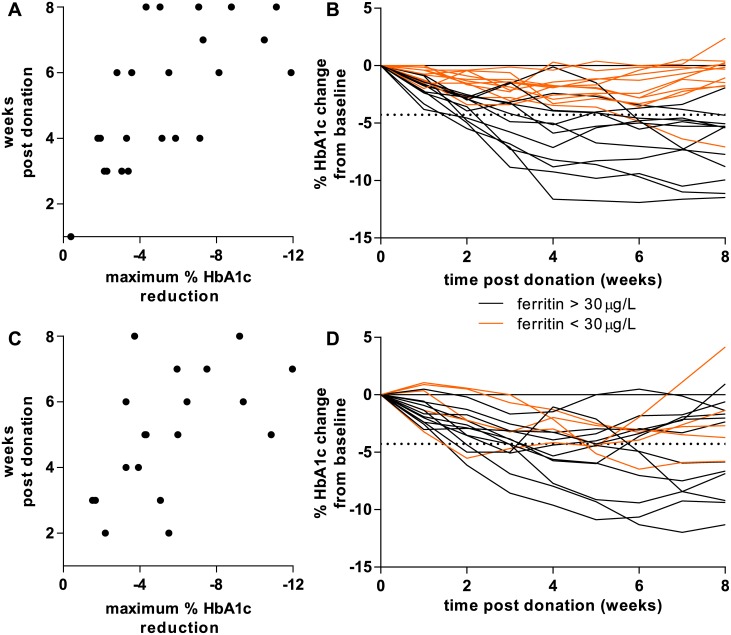
Fig 3. Dynamics of HbA1c during 8 weeks post whole blood donation (Tosoh G8).
Horizontal dotted lines represent the Tosoh G8 one-tailed RCV (-4.28%) calculated for SI units. A: 23 non-diabetic blood donors after 475 mL whole blood donation. A low maximum % reduction in HbA1c correlated with an early time point in the study, a high maximum % reduction in HbA1c correlated with a late time point (Spearman r = -0.668; P = 0.0005). B: Individual changes of HbA1c in 23 non-diabetic blood donors. The orange lines represent non-diabetic blood donors with low ferritin (<30 μg/L). C: 17 blood donors with type 2 diabetes after 475 mL whole blood donation. A low maximum % reduction in HbA1c correlated with an early time point in the study, a high maximum % reduction in HbA1c correlated with a late time point (Spearman r = -0.547; P = 0.015). D: Individual changes of HbA1c in 17 blood donors with type 2 diabetes. The orange lines represent blood donors with type 2 diabetes with low ferritin (<30 μg/L).

