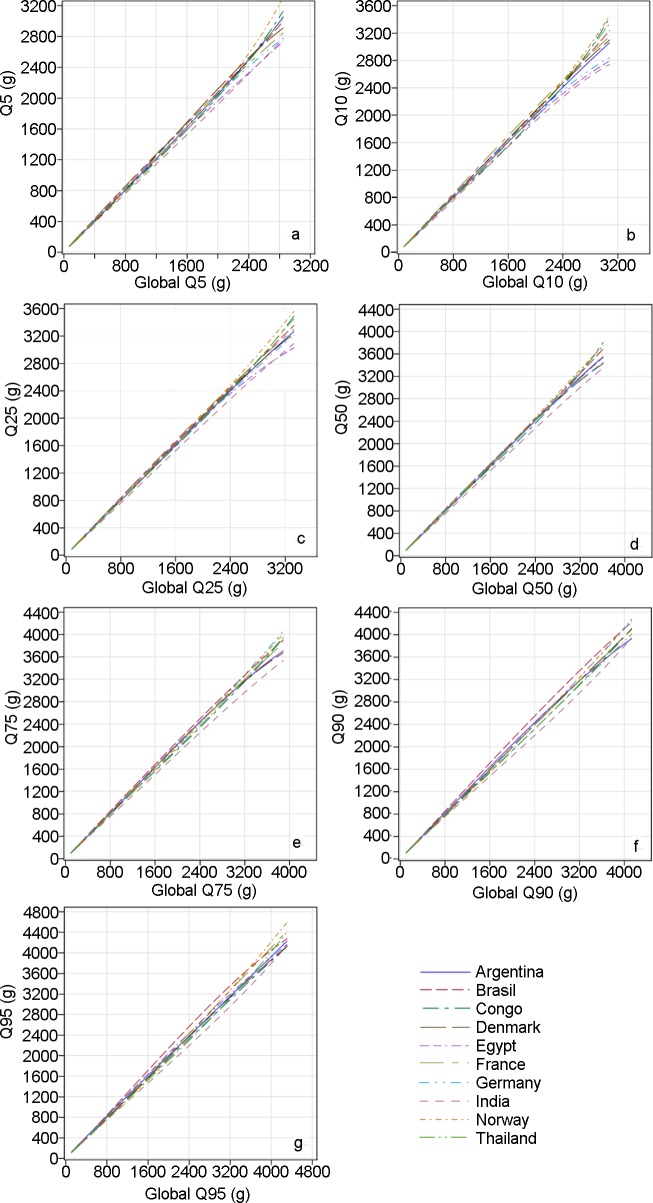
Fig 4. Quantile–quantile plots comparing countries’ distributions with the global distribution of estimated fetal weight.
The 5th, 10th, 25th, 50th, 75th, 90th, and 95th percentiles (Q05, Q10, Q25, Q50, Q75, and Q90, respectively) for the distribution of each country are plotted versus the same percentiles of the global distribution (global Q05, global Q10, global Q25, global Q50, global Q75, global Q90, respectively). Congo, Democratic Republic of the Congo.

