Figure 4.
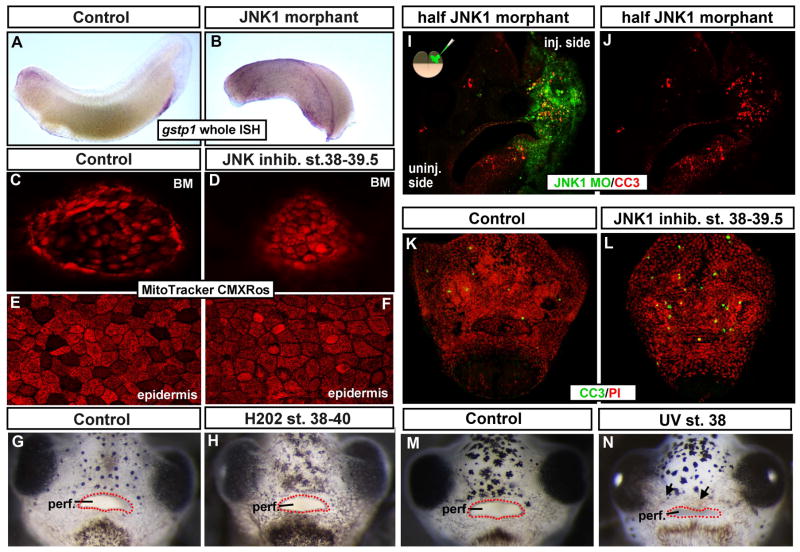
A,B) Lateral view of representative controls (A) and JNK1 morphants (B) where gst1 mRNA (purple) was detected by in situ hybridization. C–F) Live Mitotracker CMXRos labeling (red) after embryos were treated with DMSO (control; C, E) or JNK inhibitor. C, D) Shows the buccopharyngeal membrane. E, F) Shows the epidermis. G, H) Frontal views of the face of representative embryos untreated (G) or treated with hydrogen peroxide (H202; H). Red dots outline the embryonic mouth. I, J) Transverse sections through the face of a representative embryo injected with JNK1 morpholino into one cell at the two cell stage. Tissue containing the fluorescein tagged JNK1 morpholino is green and cleaved caspase-3 labeling (apoptotic marker) is in red. K, L) Frontal views of whole representative faces from embryos treated with DMSO (K) or JNK inhibitor (L). Cleaved caspase-3 labeling is in green and propidium iodide is used a counterstain (red). M, N) Representative images of frontal views of faces of embryos exposed to UV. M) Control (not irradiated) and N) Irradiated at stage 37/38. Red dots outline the embryonic mouth. Abbreviations; perf. =perforated, MO= morpholino, BM = buccopharyngeal membrane, CC3=cleaved caspase 3, PI= propidium iodide.

