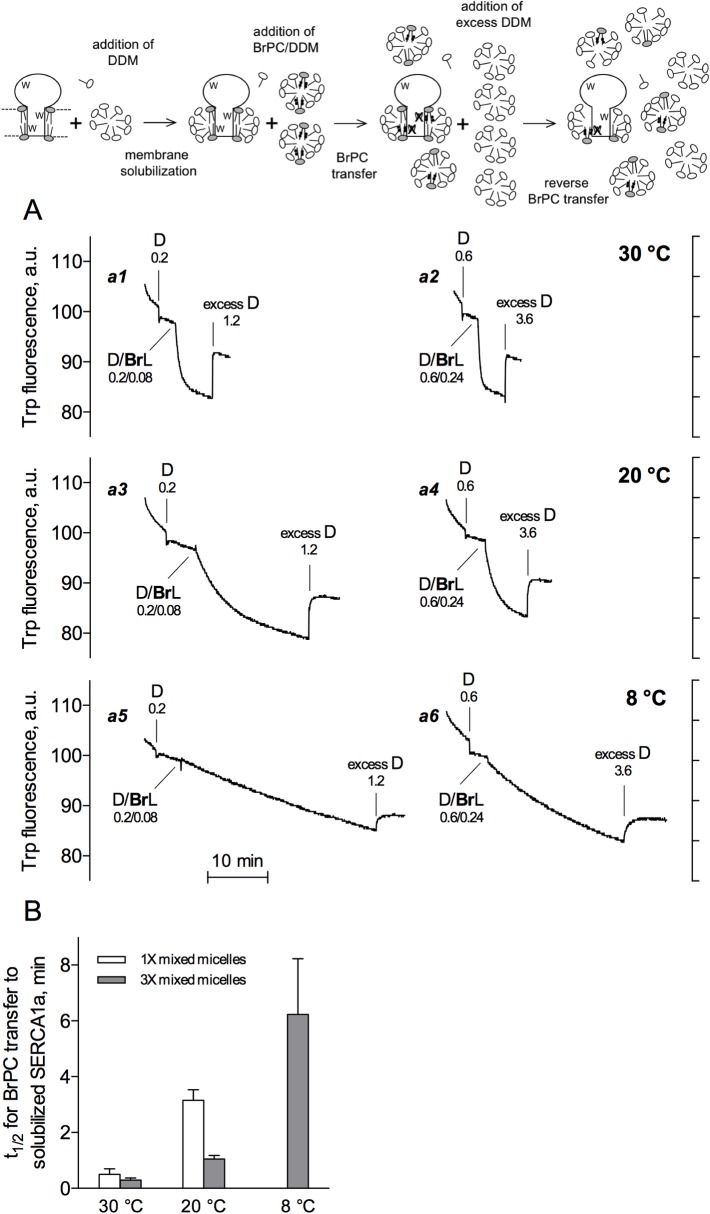
Fig 2. Kinetics of BrPC exchange in the presence of different amounts of the same mixed micelles, and at various temperatures.
For these experiments, buffer B was used. (A) For Traces a1 and a2, the temperature was 30°C. To SR vesicles at 0.04 mg protein/mL and 0.02 mg endogenous lipid/mL, DDM was initially added at a concentration of either 0.2 mg/mL (Trace a1) or 0.6 mg/mL (Trace a2), resulting in membrane solubilization in both cases. Then BrPC in DDM was added, either 0.08 mg/mL in 0.2 mg/mL (Trace a1) or 0.24 mg/mL in 0.6 mg/mL (Trace a2). The total DDM concentrations therefore were 0.4 or 1.2 mg/mL, but the BrPC/DDM ratio remained the same. At the end, ‘excess’ DDM was added, at 1.2 or 3.6 mg/ml. The final total DDM concentrations therefore were 1.6 or 4.8 mg/mL. Traces a3 and a4, same as a1 and a2 but the temperature was 20°C. Traces a5 and a6, same as a1 and a2 but the temperature was 8°C. Traces have not been corrected for dilution effects. In the case of Traces a2, a4, and a6, this dilution effect only becomes somewhat significant when adding excess DDM at 3.6 mg/mL (36 μL of a 200 mg/mL stock solution resulting in a 1.8% dilution). The cartoon on top depicts the principle of the experiment. Each trace corresponds to one experiment representative of three to four independent experiments. Numbers in panel A indicate the concentrations of detergent and lipid added to the cuvette at each step, in mg/mL. (B) Half-times for BrPC exchange calculated from traces displayed in (A). Note that when experiments were performed at 8°C and in the presence of mixed D/BrL micelles at only a 1X concentration (Trace a5), because of the much slower rate of phospholipid exchange at this temperature, we could not reliably extract rate constants for the exchange process. Data are presented as the mean ± S.D. (error bars) of three to four independent experiments.

