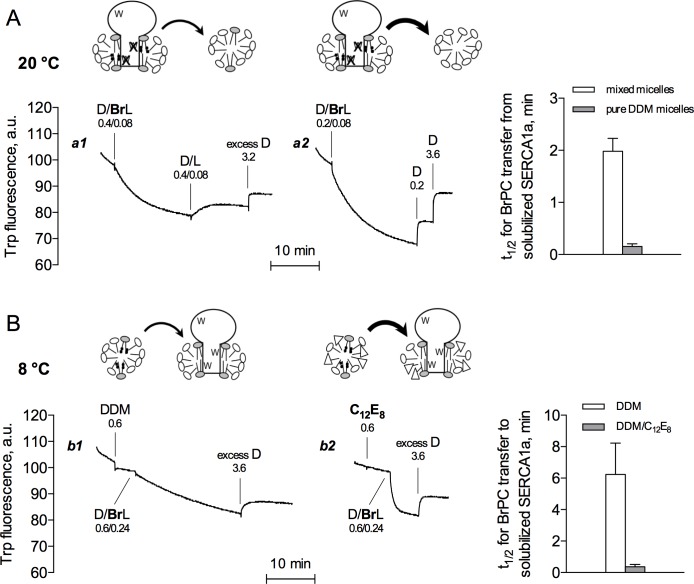
Fig 3. BrPC transfer is greatly accelerated during asymmetrical transfer, as well as in the additional presence of C12E8.
(A) Temperature was 20°C and buffer A was used, as for Fig 1. Each trace corresponds to one experiment representative of three independent experiments. Trace a1 illustrates an experiment similar to that previously shown as Trace a2 of Fig 1 (identical assay conditions but independent experiments). Trace a2 shows a related experiment, where brominated lipid was first added at a higher bromolipid to detergent ratio, as indicated, while subsequently only DDM was added, in two steps, to monitor the kinetics of fluorescence recovery under ‘asymmetrical’ conditions. The histograms on the right represent half-times for BrPC transfer from solubilized SERCA1a to either mixed egg PC/DDM micelles (open bars, as in Trace a1) or pure DDM micelles (grey bars, as in Trace a2). Data are presented as the mean ± S.D. (error bars) of three independent experiments. (B) Temperature was here 8°C and buffer B was used. Each trace corresponds to one experiment representative of three independent experiments. Trace b1 illustrates an experiment similar to that previously shown as Trace a6 of Fig 2 (identical assay conditions but independent experiment). Trace b2 shows a related experiment, where membranes were initially solubilized with C12E8 at 0.6 mg/mL instead of DDM. Then BrPC in DDM was added (at 0.24 mg/mL and 0.6 mg/mL, respectively), as for the left trace. Phospholipid exchange therefore now took place in the presence of 0.24 mg/mL BrPC, 0.6 mg/mL DDM and 0.6 mg/mL C12E8 instead of 0.24 mg/mL BrPC and 1.2 mg/mL DDM. Since detergent itself is thought to exchange rapidly, DDM and C12E8 presumably soon exchanged with each other, hence the cartoon on the right representing a mixed ternary micelle and a protein belt with both detergents. In this cartoon, the polar headgroup of C12E8 is represented as triangles. At the end, excess DDM was added at 3.6 mg/ml, so that total DDM and C12E8 concentrations were 4.2 and 0.6 mg/mL, respectively. Numbers indicate the concentrations of detergent and lipid added to the cuvette at each step, in mg/mL. The histograms on the right represent half-times for BrPC transfer to solubilized SERCA1a calculated from traces of the same panel. Data are presented as the mean ± S.D. (error bars) of three independent experiments.

