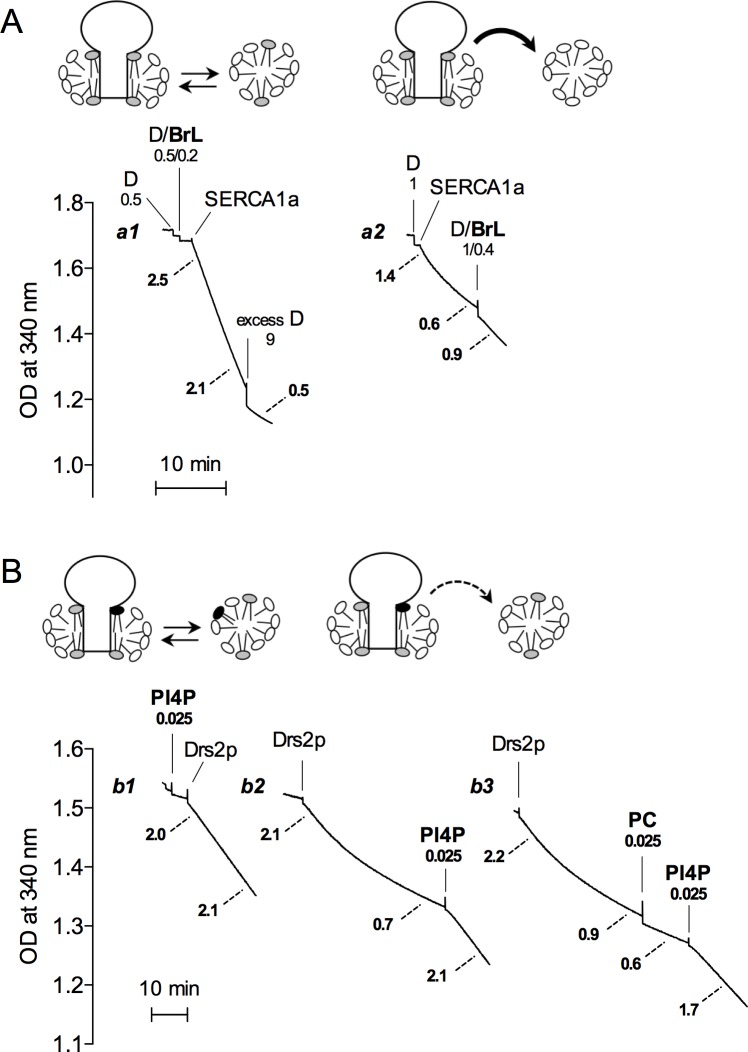
Fig 4. Slow phospholipid transfer can also be detected by functional measurements.
(A) ATPase activity measurements with SERCA1a. SERCA1a at 2 mg protein/mL was solubilized with mixed micelles at 10 mg/mL DDM and 2 mg/mL BrPC. This solubilized enzyme was diluted 500-fold into either (Trace a1) buffer A to which a total of 1 mg/mL DDM and 0.2 mg/mL BrPC had been added (and excess DDM at 9 mg/mL was added at the end), or (Trace a2) buffer A to which 1 mg/mL DDM only had been added. In the latter case, mixed micelles were added after some time, resulting in final concentrations of detergent and lipid twice higher than those in Trace a1 (2 mg/mL DDM and 0.4 mg/mL BrPC), but at the same detergent/lipid ratio. ATPase activity was measured at 20°C. The cartoon on top depicts the principle of the experiment. Lipids and detergent molecules are represented with grey and white headgroups, respectively. (B) ATPase activity measurements with purified and chymotrypsin-treated Drs2p/Cdc50p complex. To be able to reveal the ATPase activity of the complex using the enzyme-coupled assay, we first subjected the purified Drs2p/Cdc50p to limited proteolysis with chymotrypsin in the presence of DDM, PS and PI4P (see Materials and Methods). This treatment relieves auto-inhibition of Drs2p/Cdc50p, increasing significantly its ATP hydrolysis rate (manuscript in preparation). The protein concentration of the purified and proteolyzed sample was 0.12 mg/mL. After dilution, its ATPase activity was assayed at 30°C in buffer B, supplemented with 20% glycerol as well as with 0.8 mg/mL DDM and 0.06 mg/mL POPS. For Trace b1, this medium was also supplemented with 0.025 mg/mL PI4P and with 0.25 mg/mL DDM, and the chymotrypsin-treated Drs2p/Cdc50p sample was then added, with 180-fold dilution. For Trace b2, the Drs2p/Cdc50p sample was directly added, and 0.025 mg/mL PI4P together with 0.25 mg/mL DDM was only added after a few tens of minutes. For Trace b3, after adding the Drs2p/Cdc50p sample, 0.025 mg/mL egg PC (PC) was first added together with 0.25 mg/mL DDM, and 0.025 mg/mL PI4P together with 0.25 mg/mL DDM was subsequently added. The cartoon on the left depicts the principle of the experiment illustrated by Trace b1 while the cartoon on the right depicts the principle of the experiments illustrated by Traces b2 and b3. PI4P is represented with a black headgroup while POPS is represented with a grey headgroup. Numbers at the edge of dotted lines represent the specific activity (in μmol.min-1.mg-1) calculated from the slopes of the corresponding traces. Each trace corresponds to one experiment representative of two to three independent experiments.

