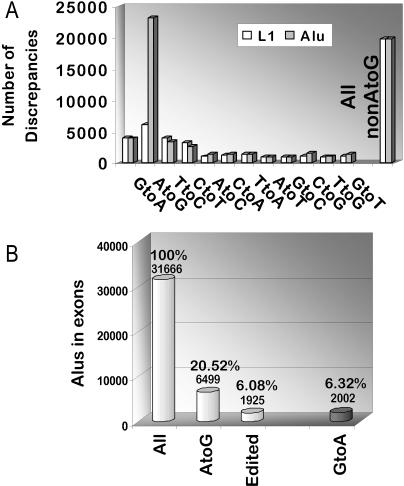
Figure 6. Mismatch Bias in Exonic Repetitive-Element Sequences.
(A) Plot of the nature and number of mismatches within Alu and L1 sequences present in human cDNAs. For reasons of comparison the L1 mismatch numbers have been multiplied by 2.9 so that the non-AtoG mismatch count for Alu and L1 is identical. Transition mismatches AtoG, GtoA, CtoT, and TtoC are displayed together for comparison.
(B) Plotted are the total number of Alu sequences found in human cDNAs (first column) and the number of elements harboring AtoG and GtoA mismatches (second and last column). The third column indicates the high confidence set of edited elements (α = 0.000001).

