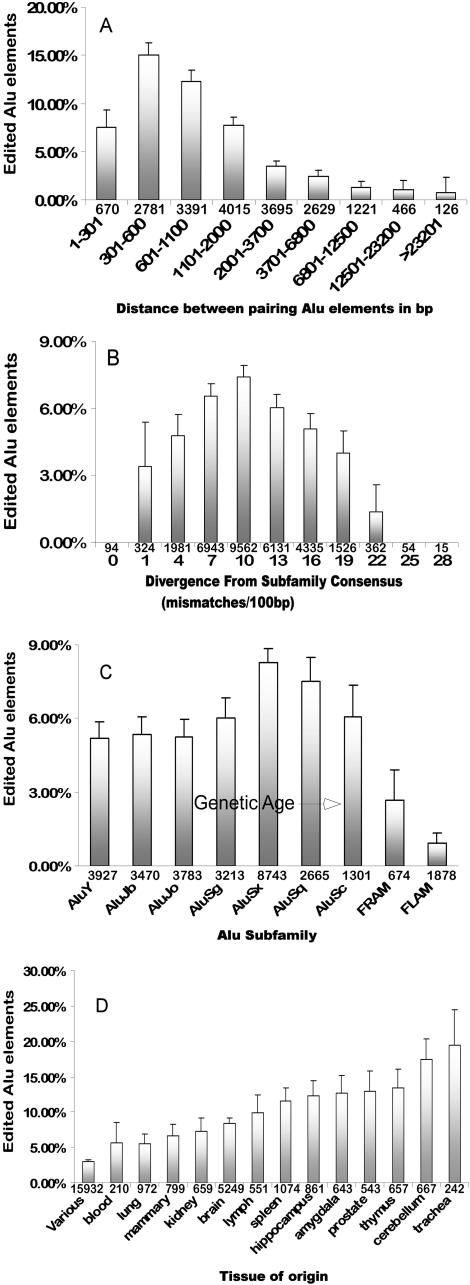
Figure 7. Factors Determining Alu Targeting Probability.
(A) Percentage of edited elements classified in bins according to the distance separating the element and its closest inverted Alu partner.
(B) Percentage of edited Alu elements clustered according to divergence from their corresponding Alu-subfamily consensus.
(C) Percentage of edited Alu elements in each Alu subfamily.
In (A), (B), and (C) the numbers at the bottom of the bars show the sample size in each bin. (D) Percentage of edited elements according to the tissue from which the RNA was isolated. Error bars show 95% confidence levels.

