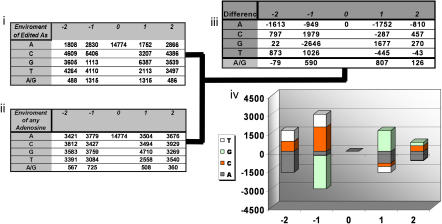
Figure 9. Cis Preferences of Editing Sites in Alus.
Tables (i) and (ii) show the frequency of A, G, C, T, or an A/G editing site at positions −2, −1, 1, and 2 relative to each of the 14,774 AtoG mismatch sites found within the high confidence group of Alu elements (i) and in relation to a randomly chosen adenosine from each of the those sequences for each AtoG mismatch (ii). Table (iii) shows relative editing preferences after bias removal by subtracting table (ii) from Table (i). (iv) Graphical representation of Table (iii).

