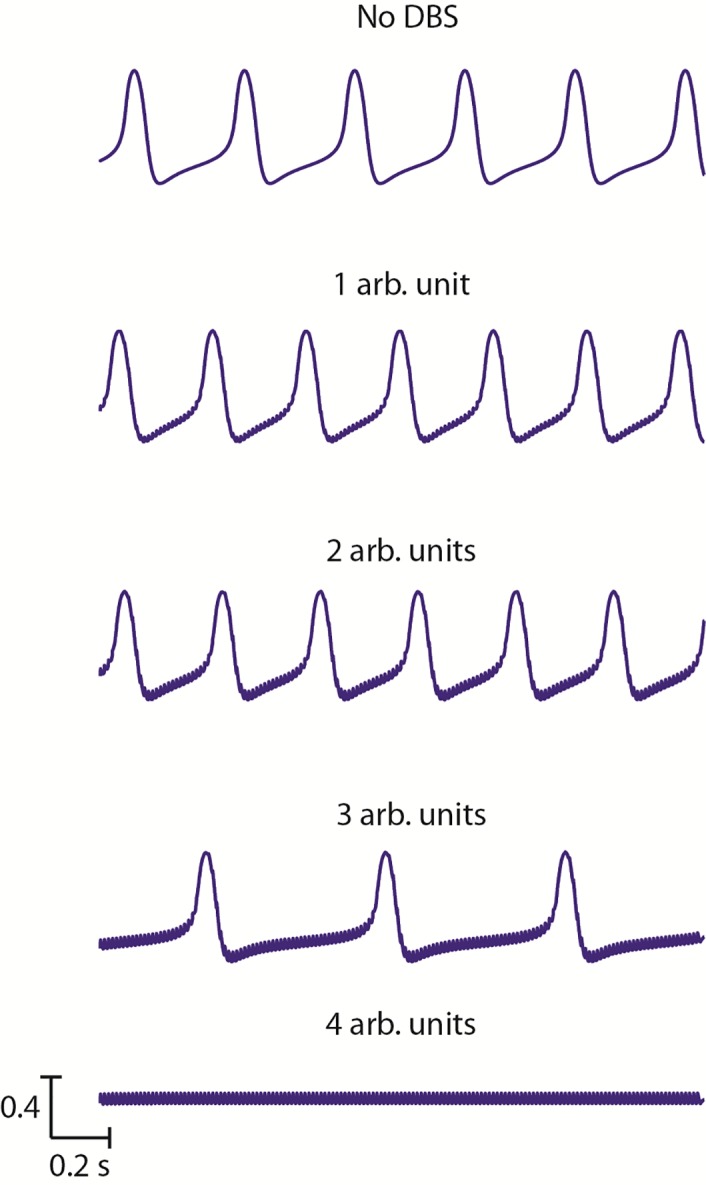
Fig 7. The change in oscillations with increasing DBS amplitude.

For a single DBS frequency, the change in Vim activity is shown as the amplitude of the stimulation increases. The baseline large amplitude tremor band activity is shown at the top, and the low-amplitude high frequency activity at the bottom. In between, the activity gradually switches from one to the other, with an initial increase in frequency at low amplitudes, followed by a decrease in frequency as the amplitude increases further.
