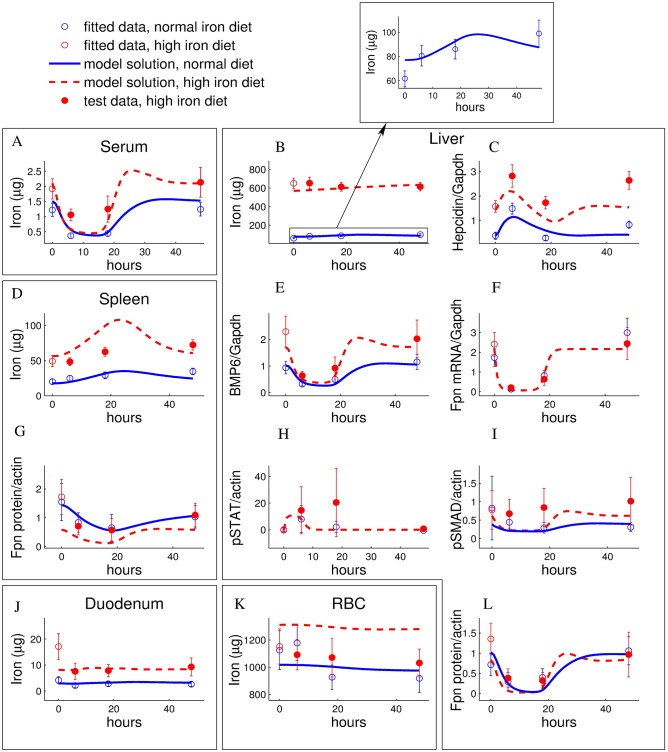
Fig 3. LPS-induced dynamics of iron-related parameters under normal/enriched iron diet is well reproduced/predicted by the model.
A-Serum iron, B-Liver Iron, C-Liver hepcidin, D-Spleen iron, E-Liver BMP6, F-Liver Fpn mRNA, G-Spleen Fpn protein, H-Liver pSTAT, I-Liver pSMAD, J-Duodenum iron, K-Red blood cells iron, L-Liver Fpn protein. 4–6 weeks old male C57BL/6-mice were administrated a normal diet, containing 200 ppm iron (blue), or a high iron diet, supplemented by 2% carbonyl iron containing about 20000 ppm iron (red). After 4 weeks, mice were injected with 1 μg LPS/g body weight and sacrificed 6/18/48 hours after the injection. Experimental data are given as means with standard deviation of 4–6 replicates and the model simulation for the best fitting parameter set is represented by curves (solid lines: fitted time courses, dashed lines: predicted time courses). Data represented be empty circles were used in fitting as a part of the calibration data set (LPS response for normal diet and the iron parameters after 4 weeks of high iron diet before injection of LPS). The LPS response for high iron diet data (filled circles) was used to test the model predictions. See Materials and Methods for the description of the experiment.

