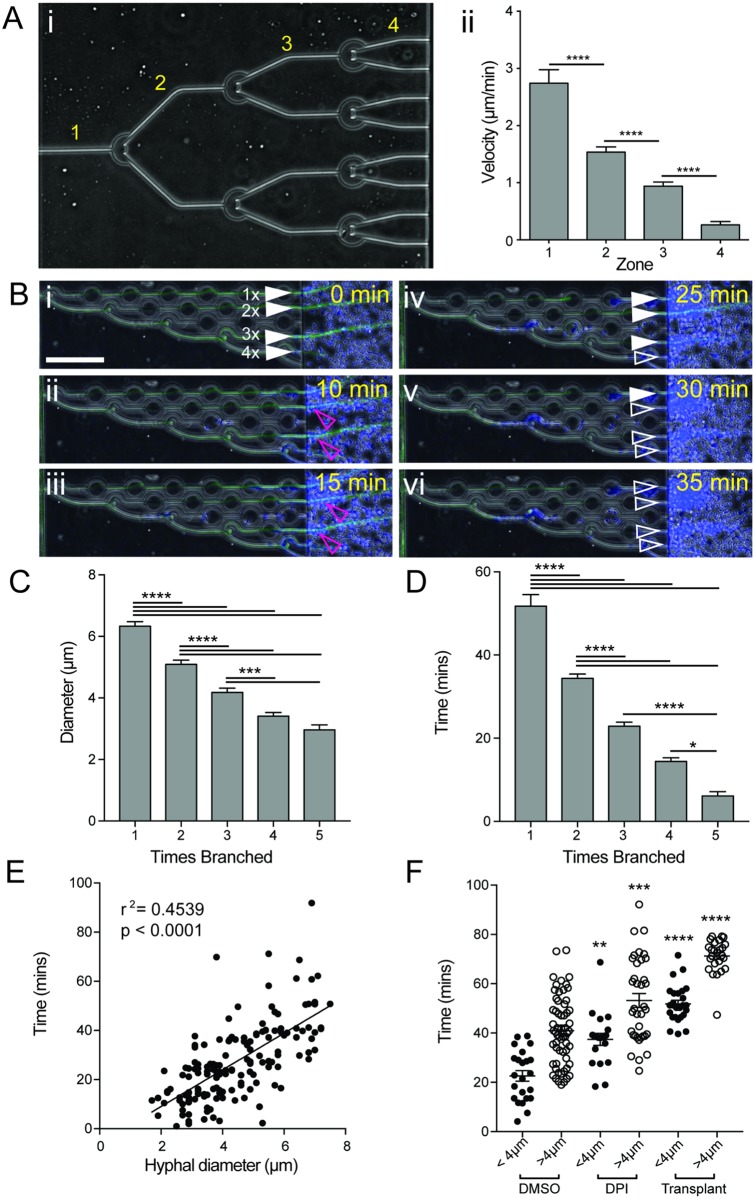
Fig 9. Branching slows growth and increases hyphal vulnerability.
(A) Sequential branching was induced by crescent-shaped obstacles to allow comparison of hyphal growth after multiple branches. Hyphae were induced to branch 3 times, increasing the number of growing tips exponentially from 1 to 8 (i, S5 Movie). Comparison of hyphal tip velocity in zones 1–4 (i) demonstrated a significant reduction in hyphal growth speed with each branching event (ii). N ≥ 4 measurements for n ≥ 4 hyphae per zone. (B) Highly branched hyphae are more susceptible to killing by neutrophils. Staggered branch induction allowed comparison of hypha (full white arrowheads) that had undergone different numbers of branching events (i, S6 Movie). Hyphae that had been branched the most were killed first (iv, open white arrowhead), while more established hypha took longer to kill (v-vi). (C) Branching significantly reduces hyphal diameter. Hyphal diameter was measured for hyphae following compound branch induction. Reduced diameters were observed following branching, with a minimum diameter of 2 μm observed. N ≥ 11 hyphae measured per condition from ≥ 3 fields of view. (D) Thinner hyphae are more susceptible to neutrophil-mediated killing. (i) Bar graph shows that more highly branched hyphae are killed more quickly by neutrophils, as indicated by loss of hyphal cytoplasmic EGFP fluorescence. N ≥ 11 hyphae measured per condition from ≥ 3 fields of view. (E) Scatterplot shows time taken for neutrophils to kill hyphae correlates well with hyphal diameter, with thicker hyphae taking longer to kill. N = 157 hyphae scored. (F) Neutrophils with reduced ROS (DPI-treated) or isolated from at-risk patients (transplant recipients, S1 Table) take longer to kill both thick (>4μm diameter) and thin (<4 μm diameter) hyphae. N≥ 20 hyphae scored per group, neutrophils from N≥ 3 individuals sampled per group. Error bars: mean ± SEM. Statistics: One-way ANOVA with Tukey’s post test. Adjusted p values: *p≤0.05, **p≤0.01, ***p≤0.001, ****p≤0.0001.

