Figure 3.
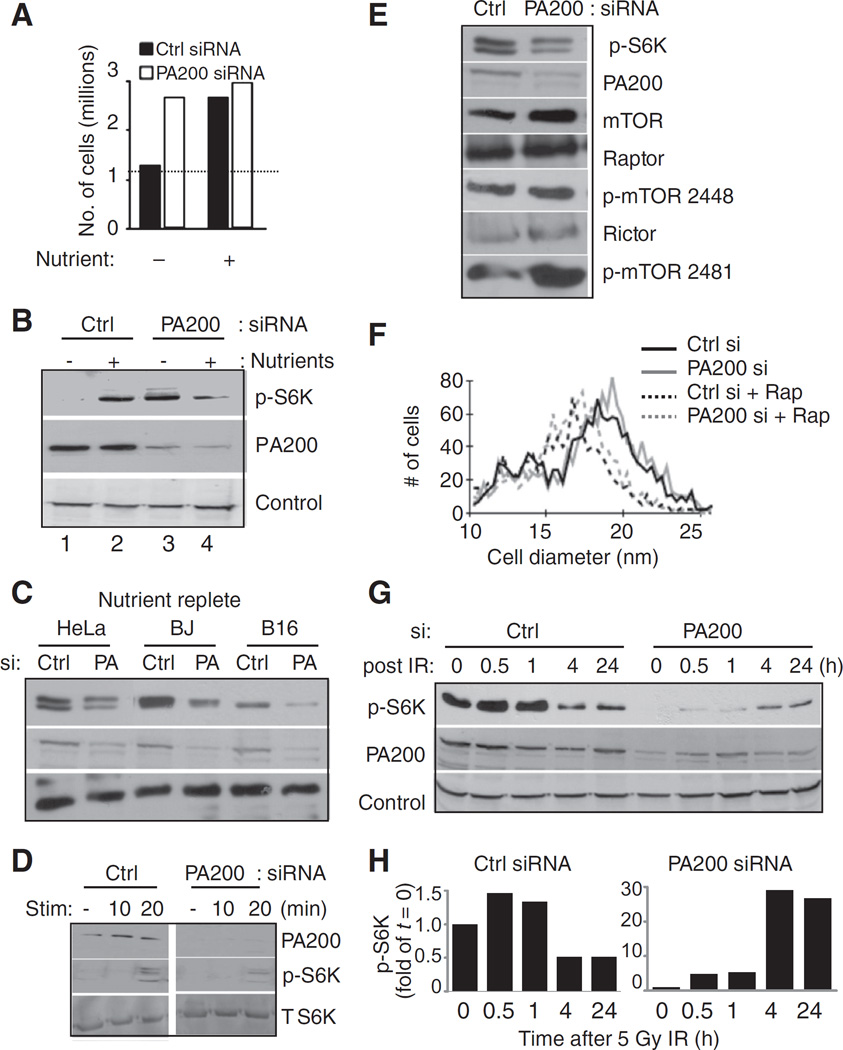
PA200 is required for mTOR responsiveness. HeLa cells were transfected with PA200-specific siRNA or nonspecific (Ctrl) siRNA and immediately plated (14.4 × 10⁴ cells/cm2) in fresh media containing 2 mmol/L glutamine. Nutrients were replenished by daily replacement of media (Nutrient+) or cells were left in the same media (Nutrient+). Three days after transfection, cells were counted and viable cells were determined by Trypan blue exclusion (A) or harvested for Western blot analysis (B). Control (Ctrl) is HSP70. C, after transfection, the indicated cells were plated (2 × 10⁴/cm2). Forty-eight hours after transfection, nutrients were replenished by media replacement. Twenty-four hours later, cells were harvested for Western blot analysis. Control is ERp57. D, after transfection, cells were plated at 2 × 10⁴/cm2. Twenty-four hours after transfection, cell media were replaced with media lacking serum. Forty-eight hours after transfection, cells were stimulated with 10% bovine calf serum for the indicated times and then harvested for Western blot analysis. T, total. E, HeLa cells were treated as in (C) followed by Western blot analysis for the indicated proteins. F, HeLa cells were treated as in (C) followed by cell diameter analysis by Vi-Cell counter (Becton Dickinson). Rap, rapamycin. G, HeLa cells transfected with PA200-specific siRNA or nonspecific siRNA (Ctrl) were plated and nutrients were replenished after 48 hours. Seventy-two hours after transfection, cells were harvested and replated. Replated cells were allowed to rest for 3 hours before irradiation. Cells were exposed to 5-Gy irradiation using Philips Mark 1 Cesium irradiator at a dose rate of 0.472 Gy/min. At the indicated times after radiation, cells were harvested for Western blot analysis of the indicated proteins. Control is HSP70. H, bands in (G) were quantified using ImageJ software. Signal of p-S6K band was normalized to the control for each time point and then the ratio was normalized to the ratio obtained at time zero. A representative figure of at least 3 independent experiments is shown for each panel.

