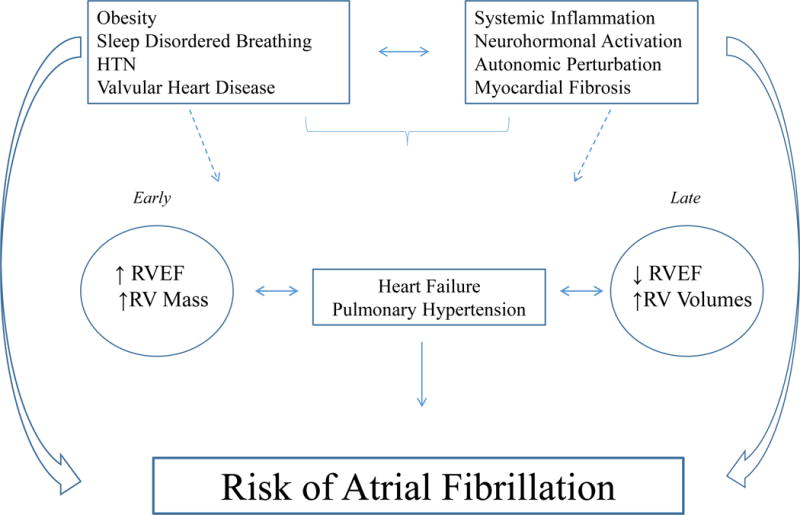
Figure 3.

Schematic representation of the possible relationships between RV morphology and AF pathogenesis. Shown is a schematic reflecting the possible relationships between clinical phenotypes, systemic processes, and temporal changes in ‘at-risk’ RV morphology (early vs. late) in the context of AF pathogenesis. RV, right ventricle; EF, ejection fraction; HTN, hypertension, PH, pulmonary hypertension.
