
Figure 1. In vitro neural differentiation generates cortical and non-cortical cells.
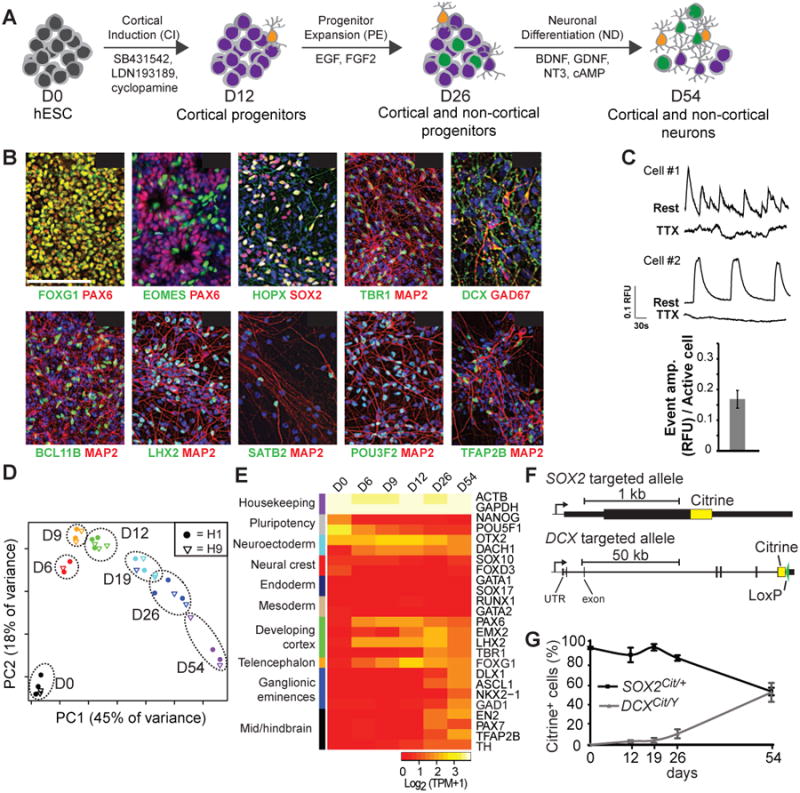
(A) Schematic representation of in vitro neural differentiation of hESCs. (B) Representative images of immunostaining on D12, D26 and D54 of H1 differentiated cells, with DAPI in blue. Scale bar: 100 μm. (C) Representative traces of calcium activity as imaged with FURA2-AM (top traces) and after blockade by TTX (bottom traces). Data quantified from three representative experiments (n = 1148 cells at D54, from 3 biological replicates) (bottom); RFU = relative fluorescent units. (D) Principal component analysis of population RNA-Seq data demonstrates the reproducibility of differentiation methods across multiple experiments from both H1 and H9 stem cell lines. (E) Population RNA-Seq expression of genes that mark indicated brain regions. (F) Schematic of targeted loci of the SOX2Cit/+ and DCXCit/Y reporter cell lines. (G) Quantitation of percent citrine positive cells during differentiation by flow cytometry. Mean ± SD is shown from 3 (SOX2Cit/+) and 6 (DCXCit/Y) biological replicates. See also Figures S1-2.