
Figure 2. Identification of cell types through single-cell transcriptomics.
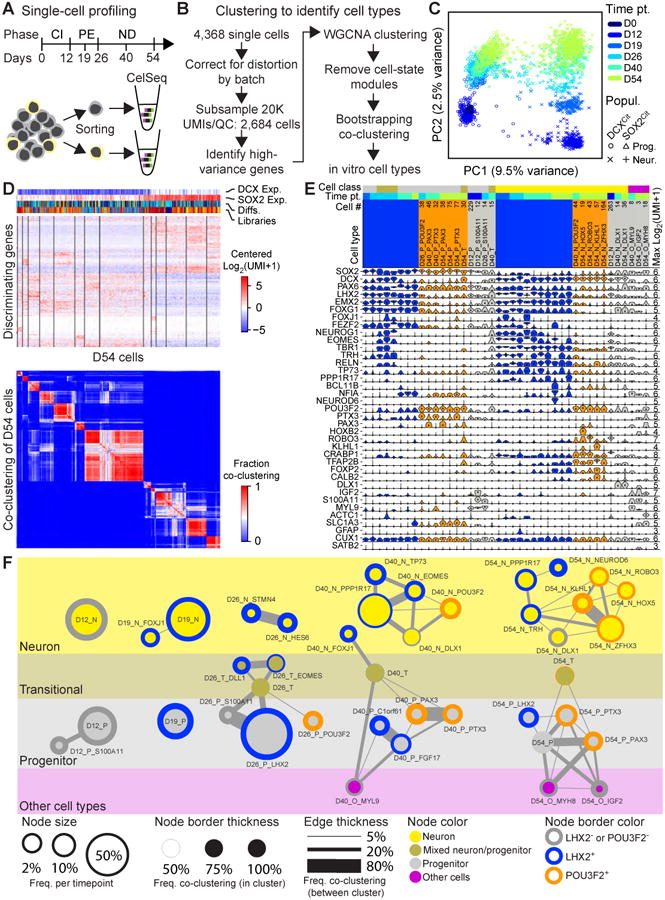
(A) Single cell-profiling strategy and (B) methodology of cell type identification from CelSeq single cell RNA-Seq data. (C) Principal component analysis of all single cells used for analysis based on high variance genes (Table S1). (D) Representative heatmap showing most distinguishing genes at D54 used to identify cell types (top, Data S1), and bootstrapping analysis of D54 cells. (E) Violin plots for most distinguishing and commonly used marker genes. Max Log2(UMI + 1) values are to the right, and the number of cell per cell type is listed above the cell type name. (F) Constellation diagram of cell types identified at D12, D19, D26, D40, and D54. Cell type name, relative number of cells per time point sampled are shown by circle size, strength of intra- and inter-cell type clustering from bootstrapping analysis are indicated by circle boarder with and edge width, and POU3F2 and LHX2 expression status are shown by circle boarder color. Neuronal cell types (yellow) were defined as cell types with strong DCX expression, Progenitors with strong SOX2 expression (gray), Transitional types express both SOX2 and DCX (gray-yellow transition), and Other cell types (pink) express genes indicative of non-neuronal lineages. See also Figures S3-4, Table S1, and Data S1-2.