
Figure 4. Stem cell-derived cell types resemble forebrain and mid/hindbrain cell types.
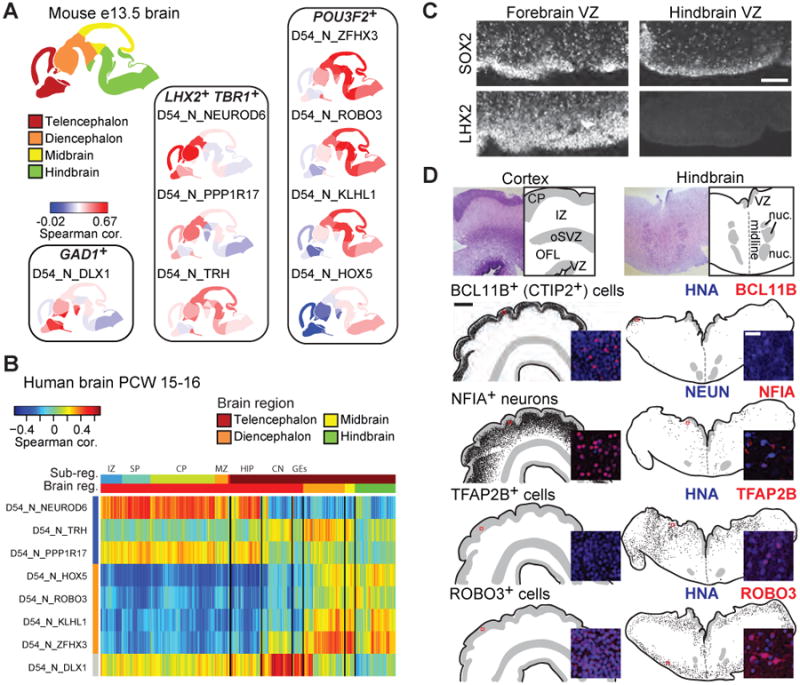
(A) Spearman correlation of D54 neuronal cell types to E13.5 Allen Brain Atlas of the Developing Mouse Brain based on genes differentially expressed between cell types and tissue regions (Table S1). Mouse regional gene expression levels are derived from in situ hybridization staining intensity. (B) Correlation of single D54 neurons with regions of the human brain from the Brainspan Atlas of the Developing Human Brain. Spearman correlations are based on genes differentially expressed between cell types and tissue regions (Table S1). (C) Fluorescence micrographs of 122 dpc cortex and 132 dpc hindbrain. LHX2 marks human cortical but not hindbrain progenitors, while SOX2 marks progenitors in both regions. Scale is 100 μm. (D) Immunohistochemistry of cortical and hindbrain cell type markers. Top: Nissl stain and representation of tissue architecture are shown; below: tissue representation based on DAPI staining. VZ ventricular zone, OFL outer fiber layer, oSVZ outer subventricular zone, IZ intermediate zone, CP cortical plate, nuc medullary nuclei. The entire tissue section was scored and each dot represents a positive cell. Scale is 1 mm. Inset: fluorescence micrograph showing a representative image (location indicated by red box); scale is 25 μm. See also Table S1.