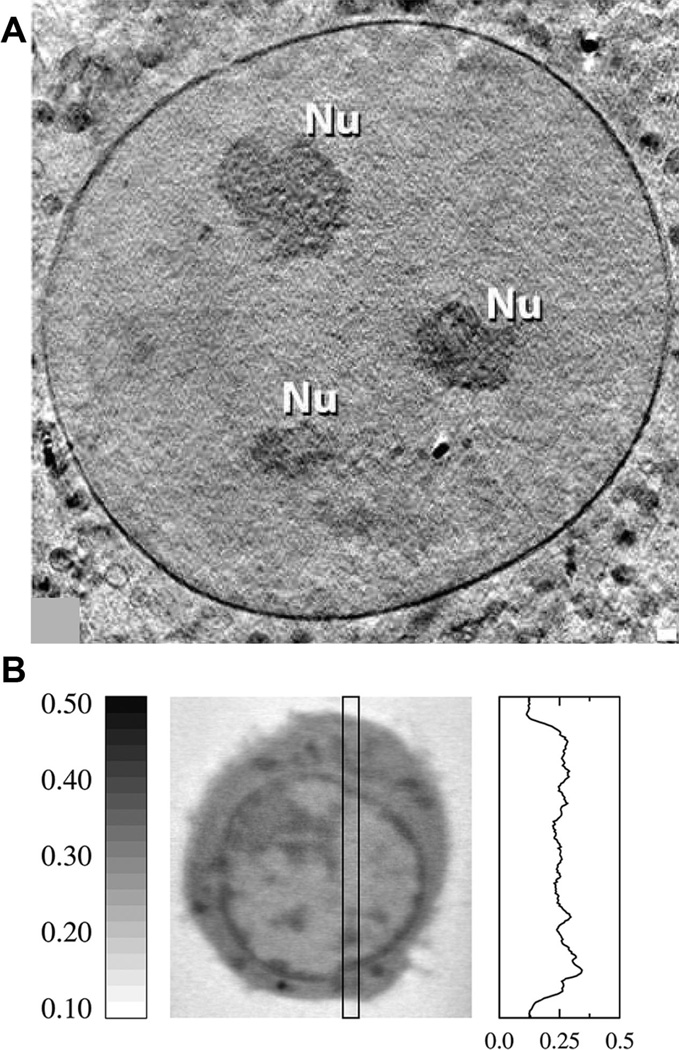
Figure 1. SXT imaging and resolution.
(A) An overview of a nucleus containing three nucleoli (Nu) showing the clarity with which the nuclear membrane can be visualized using a 25nm zone plate objective. Image taken from (Muller et al. 2012). (B) An orthoslice from a SXT reconstruction of a B-cell (center) and a representative profile of the variation of LAC within a cell (right). Dark features in the image correspond with structures containing higher concentration of carbon and thus have higher LAC values. LAC values are in units of µm−1.

