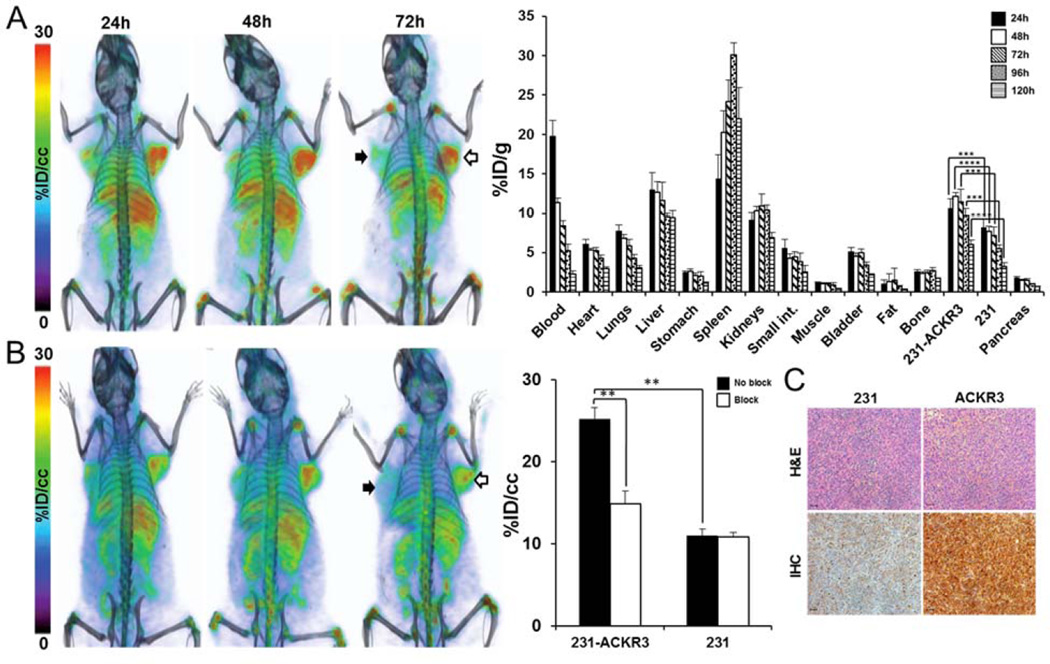
Figure 3.
89Zr-ACKR3-mAb demonstrates enhanced ACKR3-mediated in vivo uptake by ACKR3 overexpressing TNBC. Volume rendered PET-CT imaging (left) and ex vivo biodistribution (right) of 89Zr-ACKR3-mAb in 231 (black arrows)/231-ACKR3 (white arrows) xenografts (A); PET-CT imaging following blocking with 10meq of ACKR3-mAb (left) with in vivo image analysis (right) comparing blocked and non-blocked 89Zr-ACKR3-mAb tumor uptake (B); H&E staining and ACKR3 immunohistochemistry of excised tumor tissues (C), scale bars represent 50µm, ACKR3 expression in IHC is demonstrated by light brown color; 231-ACKR3 represents MDA-MB-231-ACKR3; 231 represents MDA-MB-231; p ≤ 0.01 (**), ≤ 0.001 (***), ≤ 0.0001 (****).

