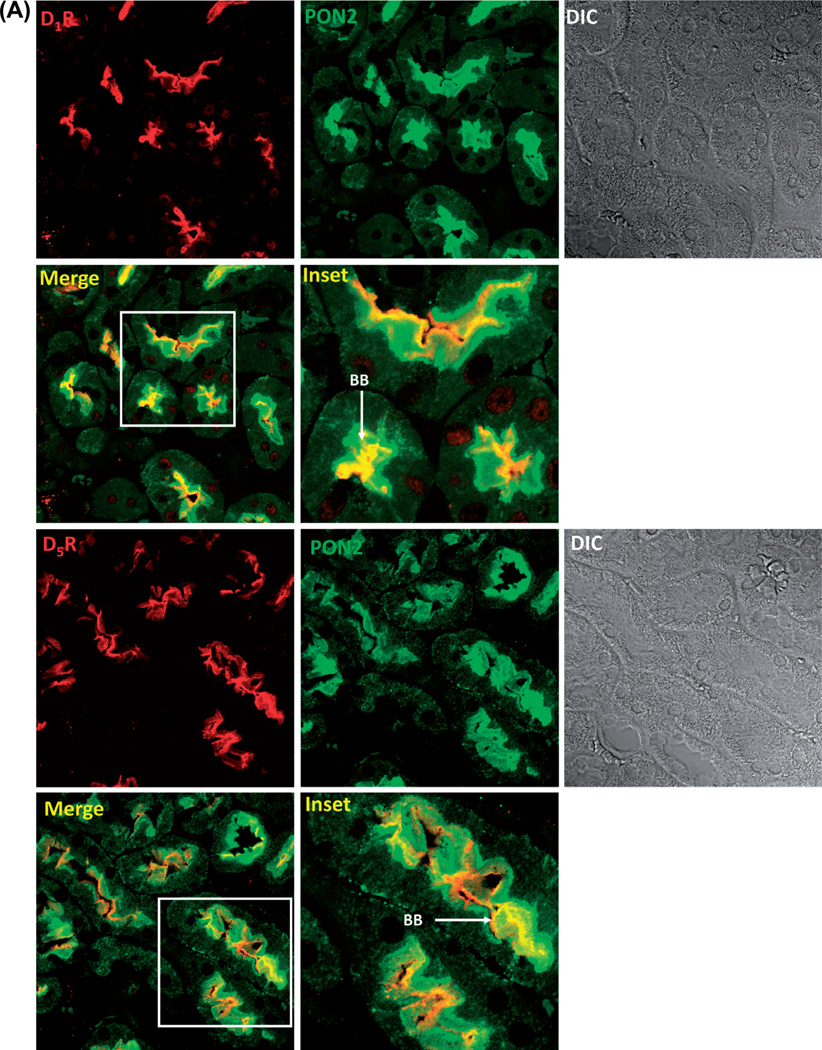
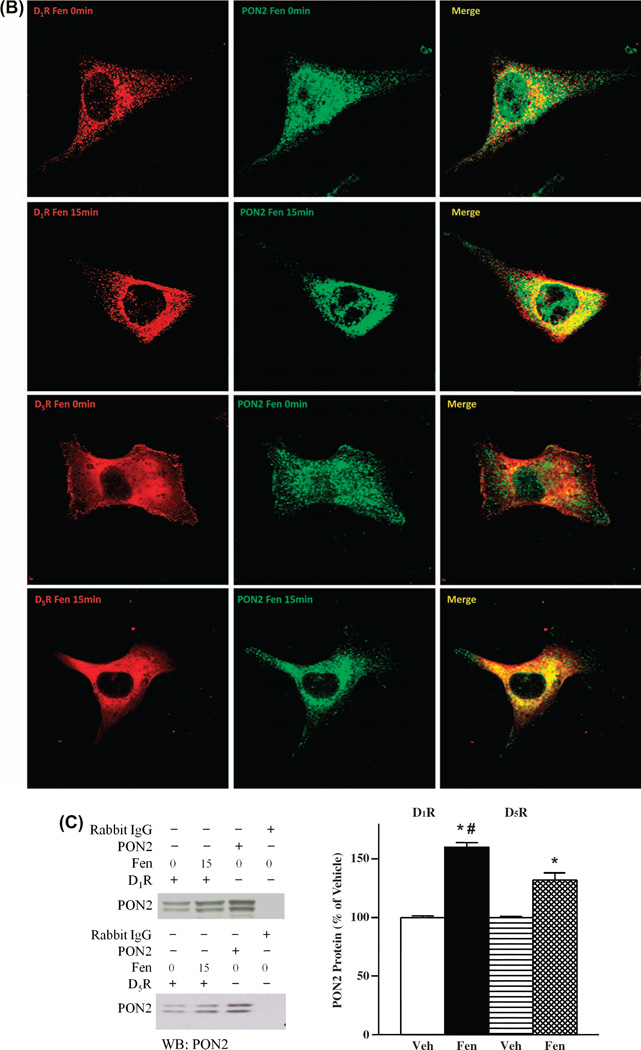
Figure 1.
Colocalization of and interaction between PON2 and D1R or D5R. (A). D1-like receptors, D1R and D5R, colocalize with PON2 in the mouse kidney. Formalin-fixed, paraffin-embedded mouse kidney sections were studied for the colocalization of D1R (red) and PON2 (green), as well as D5R (red) and PON2 (green), by confocal microscopy. The colocalization is shown as yellow in brush border membranes (BB) in the merge images. DIC = differential interference contrast. (B). D1-like receptors, D1R and D5R, colocalize with PON2 in hRPT cells. D1R (red) and D5R (red) are expressed at the plasma membrane and cytosol, while PON2 (green) is mainly distributed in the cytosol. Fenoldopam treatment (1 µM, 15 min) increased the colocalization of D1R and PON2, as well as D5R and PON2, primarily in the cytosol, shown as yellow in the merge images. Images are representative of three separate experiments. (C). D1R and PON2 and D5R and PON2 physically interact in HEK-hD1R and HEK-hD5R cells, respectively. The cells were treated with vehicle (Veh) or fenoldopam (Fen, 1 µM) for 15 min. The cell lysates were immunoprecipitated with anti-D1R, anti-D5R, and anti-PON2 (positive control) antibodies and normal rabbit IgG (negative control). The immunocomplexes were then immunoblotted with PON2 antibody. The blots are representative of one of four separate experiments. Values are mean ± SEM, *P < 0.05 vs Veh (control), #P < 0.05 vs others, the one-way factorial ANOVA, and the Newman–Keuls test.


