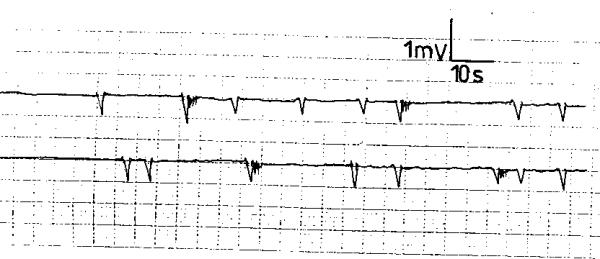
Figure 3.

Electroesophagogram of a patient with score 2 gastroesophageal reflux disease exhibiting slow waves with irregular rhythm and varying frequency, amplitude and conduction velocity from the same electrode and between the 2 electrodes of the same subject.
