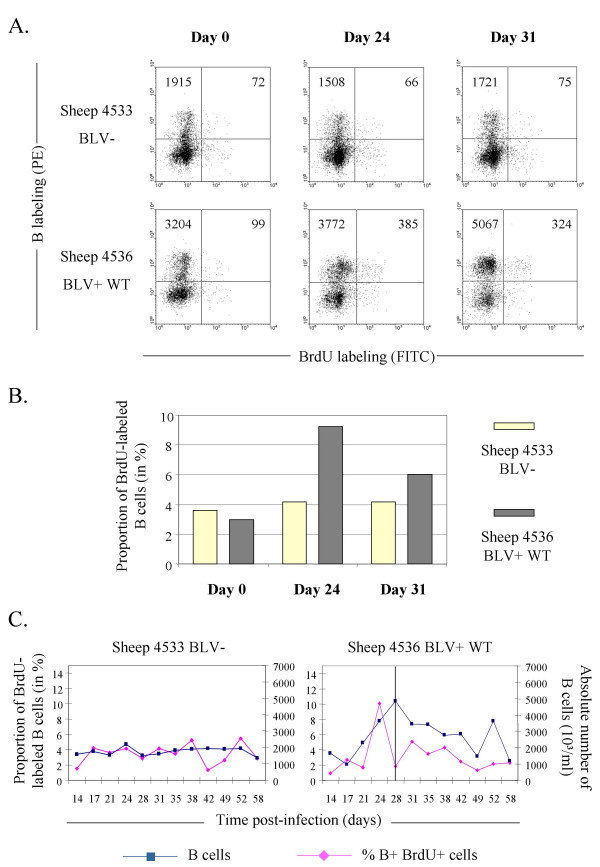
Figure 3.
The lymphocytosis correlates with increased B cell proliferation at seroconversion. Once per week over a 2 months period, 500 mg of bromodeoxyuridine (BrdU) were injected intravenously into BLV-infected (n° 4536) and control (n° 4533) sheep. An aliquot of blood (1 ml) was collected at three days post-BrdU injection. After lysis of the red blood cells, B lymphocytes were labeled with an anti-sIgM antibody. Next, cells were stained with anti-BrdU FITC in the presence of DNase and analyzed by two-color flow cytometry. A. Dot Plot graphs of B lymphocytes (Y axis) labeled in combination with BrdU (X axis) in uninfected control animal (n° 4533) and in a BLV wild type infected sheep (n° 4536) performed at days 0, 24 and 31. Day 31 corresponds to the first data obtained just after seroconversion of sheep n° 4536. Ten thousand events were acquired by flow cytometry and PBMCs were selected by the FSC/SSC gating method. The total numbers of B cells are indicated in the upper quadrants. B. Histogram of the proportions of BrdU+ labeled B cells (in % of the total B lymphocyte population). C. Graphic representation of the proportions of B+BrdU+ cells within the total B lymphocyte population (at days 3 and 7 post-injection) and the corresponding absolute numbers of B lymphocytes observed during the experiment. The BrdU was injected at days 14, 21, 28, 35, 42 and 52. The vertical line represents the detection of the seroconversion day.

