
Fig. 3.
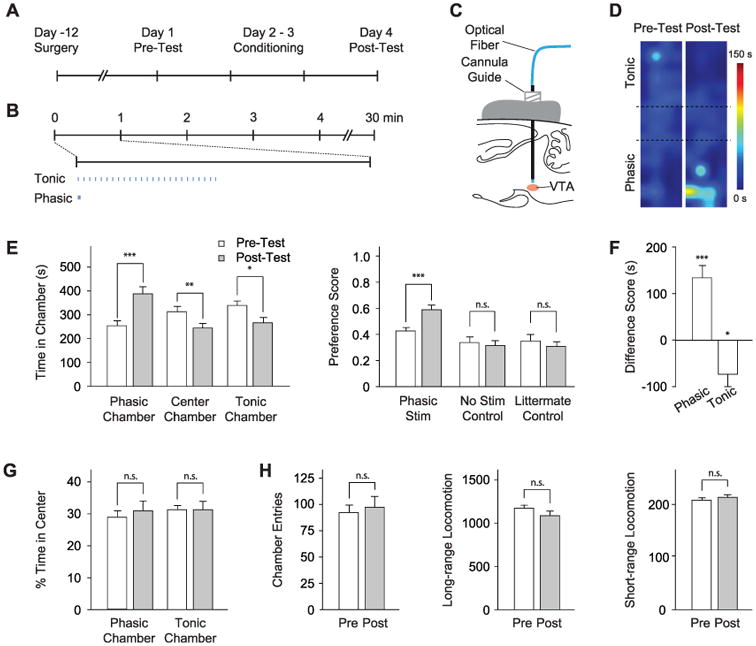
Photoactivation of DA neurons induces place preference. (A) CPP timeline (see also fig. S3). (B) Light delivery parameters; 25 flashes at 1 or 50 Hz were delivered with a periodicity of 1 min. (C) Optical fiber is inserted through a cannula guide implanted over the VTA to photoactivate DA neurons. (D) Representative density maps showing conditioned preference; pseudocolor represents duration at each position. (E) Conditioning effect of DA neuron modulation. (Left) Comparison of time in each chamber during pretest (white) and posttest (gray). (Right) Comparison of preference scores for experimental (Phasic Stim, n = 13) and control cohorts (No Stim Control, n = 9; Littermate Control, n = 9). n.s. indicates not significant, *P < 0.05, **P < 0.01, and ***P < 0.001. (F) Difference scores (calculated as the difference between time spent during pre- and posttest in the specified chamber) for each chamber shows a statistically significant shift in place preference. (G) Analysis of anxiety (fractional time in center of a chamber; n = 13). (H) Chamber entries, long-range locomotion (different sequential beam breaks), and short-range locomotion (repeated break of the same beam) during pre- and posttest (n = 13).