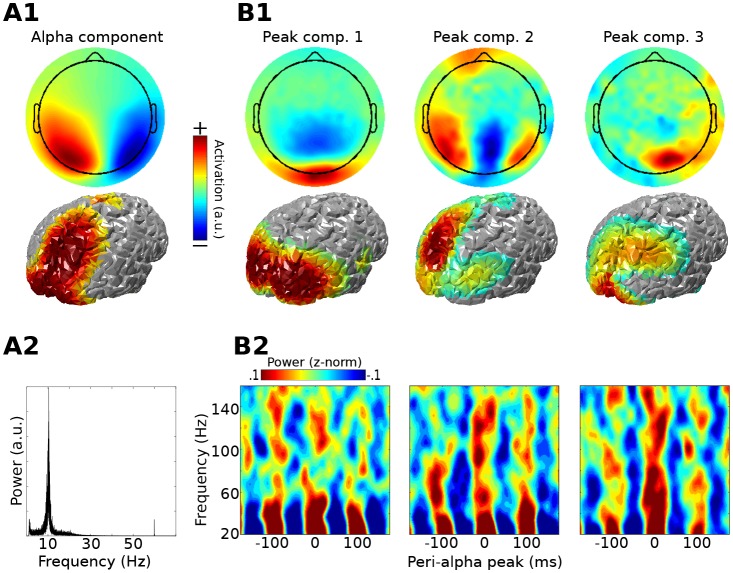
Figure 2. Method 1 applied to empirical MEG resting-state data.
An alpha component was computed using GED; its topographical projection and power spectrum are shown in (A1) and (A2). Covariance matrices from broadband data surrounding high-power alpha peaks were computed, and were entered into gedCFC using a covariance matrix from the broadband signal from the entire time series as reference. The first three components (topographical projections and projections onto the cortical surface in (B1)) along with their time-frequency power spectra locked to alpha peaks (B2) are shown.

