. 2017 Jan 24;6:e21166. doi: 10.7554/eLife.21166

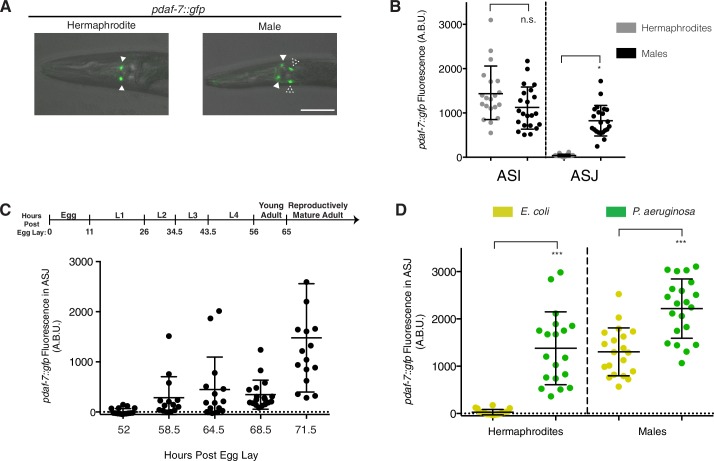
Figure 1. Sex-specific expression of daf-7 in the ASJ neurons of adult males.

(A) pdaf-7::gfp expression pattern in hermaphrodites (left) and males (right). Filled triangles indicate the ASI neurons; dashed triangles indicate the ASJ neurons. Scale bar indicates 50 µm. (B) Maximum fluorescence values of pdaf-7::gfp in the ASI (left) and ASJ (right) neurons of age-matched adult hermaphrodites (grey) and males (black). *p<0.05 as determined by an unpaired t-test with Welch’s correction. Error bars indicate standard deviation (SD). n.s., not significant. (C) Maximum fluorescence values of pdaf-7::gfp in the ASJ neurons of males through larval development and early adulthood. The developmental timeline of C. elegans is shown to scale on top. Time values indicate hours after an egg is laid. Error bars indicate SD. (D) Maximum fluorescence values of pdaf-7::gfp in the ASJ neurons of both males and hermaphrodites on E. coli (yellow) or P.aeruginosa (green). ***p<0.001 as determined by unpaired t-tests with Welch’s correction. Error bars indicate SD.

DOI: http://dx.doi.org/10.7554/eLife.21166.003

Figure 1.

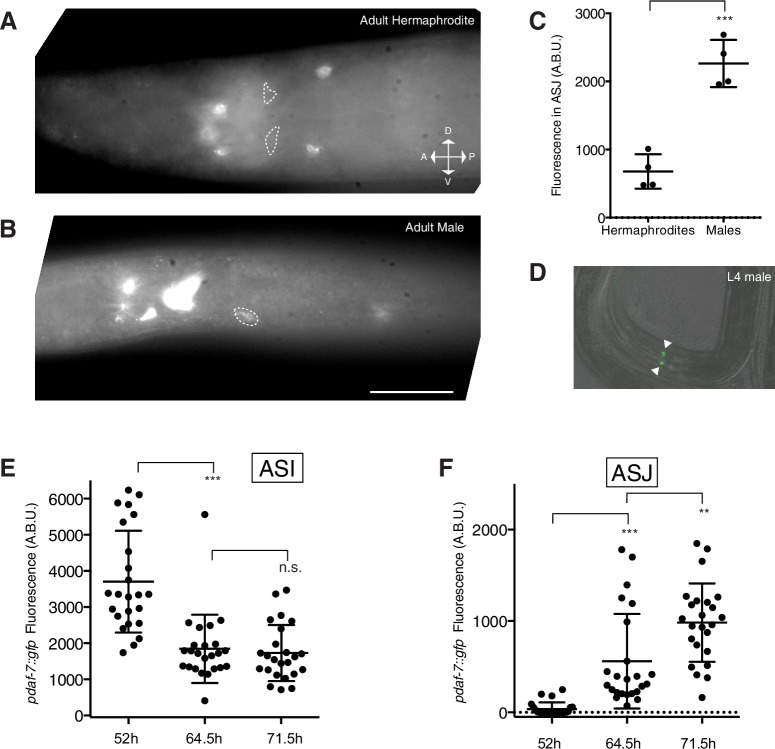
Figure 1—figure supplement 1. daf-7 expression in the ASJ neuron pair is specific to adult males.

Figure 1—figure supplement 1.

(A–B) FISH images of endogenous daf-7 mRNA in adult hermaphrodite (A) and adult male (B). White dotted lines indicate outline of the ASJ neuron(s). Both images are a single slice through the animal where ptrx-1::gfp was visible and in focus in one or both ASJ neurons. Other neurons visible anterior to the ASI neurons are likely the OLQ neurons, and the cells posterior to the ASJ neurons that express daf-7 mRNA are likely the ADE neurons. Scale bar represents 25 µm. Orientation provided in (A) applies to both images. (C) Fluorescence quantification for daf-7-Cy5 probe in the ASJ neurons (as localized by ptrx-1::gfp) in males and hermaphrodites. ***p<0.001 as determined by unpaired t-test with Welch’s correction. Error bars represent SD. (D) pdaf-7::gfp expression pattern in an L4 larval male. Filled triangles indicate the ASI neurons. Scale bar (shown in C) indicates 50 µm. (E–F) Maximum fluorescence values of pdaf-7::gfp in the ASI (E) and ASJ (F) neurons of developing males. **p<0.01, ***p<0.001, as determined by unpaired t-test with Welch’s correction. Error bars represent SD. n.s., not significant.