. 2017 Jan 24;6:e21166. doi: 10.7554/eLife.21166

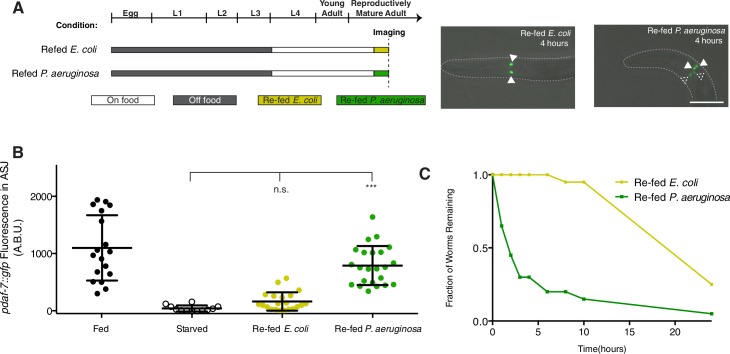
Figure 5. Prioritization of multiple inputs through the regulation of daf-7 expression in the ASJ neurons of males.

(A) Schematic of refeeding experimental design indicating timing and duration of each starving and feeding period (left). On right, representative images of daf-7 expression following 4 hr of post-starvation refeeding on E.coli (left) or P.aeruginosa (right). Closed triangles indicate the ASI neurons; dashed triangles indicate the ASJ neurons. Scale bar represents 50 µm. (B) Maximum fluorescence values of pdaf-7::gfp in the ASJ neurons of fed and starved animals and animals that were starved for a period of 24 hr and then reintroduced either to the normal E. coli food source or to pathogenic P. aeruginosa. Images were taken for quantification after 4 hr of re-feeding. ***p<0.001 as determined by ordinary one-way ANOVA followed by Dunnett’s multiple comparisons test. Error bars indicate SD. n.s., not significant. (C) Representative curve of food-leaving data in starved animals on E. coli (yellow) and P. aeruginosa (green). Animals were starved as in previous experiments before being run in the assay.

DOI: http://dx.doi.org/10.7554/eLife.21166.012

Figure 5.

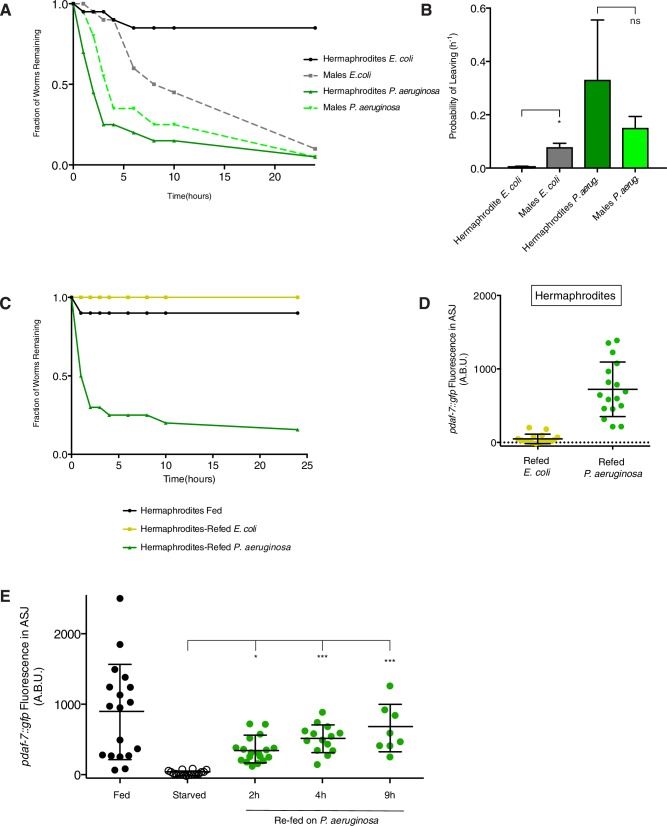
Figure 5—figure supplement 1. P. aeruginosa influences exploratory behavior and daf-7 expression in both males and hermaphrodites.

Figure 5—figure supplement 1.

(A) Representative leaving curves for males (dashed) and hermaphrodites (solid) on E. coli (shades of grey) and P. aeruginosa (shades of green). All strains were fed in this experiment. (B) Probability of leaving values for males and hermaphrodites on E. coli and P. aeruginosa. All strains were fed in these experiments. Values plotted are the mean + SEM for two independent experiments, n = 40 animals for all conditions. *p<0.05 as determined by unpaired t-test with Welch’s correction. n.s., not significant. (C) Representative raw data curves for starved hermaphrodites on E. coli and P. aeruginosa. Fed hermaphrodites shown as control. (D) Maximum fluorescence of pdaf-7::gfp in the ASJ neurons of starved hermaphrodites re-fed E. coli or P. aeruginosa for four hours (compare to Figure 5B). Error bars indicate SD. (E) Maximum fluorescence values of pdaf-7::gfp in the ASJ neurons of fed and starved animals and animals that were starved for a period of 24 hr and then reintroduced to P. aeruginosa for the indicated amount of time. The experiment in Figure 4B was run in parallel, controls (fed and starved) were shared between conditions. These controls are shown in both figures for comparison purposes. *p<0.05 and ***p<0.001, as determined by ordinary one-way ANOVA followed by Dunnett’s multiple comparisons test. Error bars indicate S.D.