. 2017 Jan 24;6:e19157. doi: 10.7554/eLife.19157

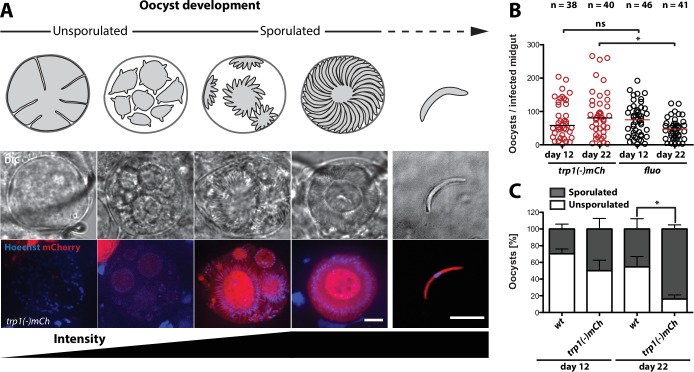
Figure 2. trp1(-) oocysts sporulate normally and persist in a sporulated state.

(A) Expression of mCherry in trp1(-)mCh parasites was only observed in sporulating oocysts and sporozoites. The developmental stage of the oocysts is depicted schematically above the images, while the increase in fluorescence intensity is schematically indicated below. Strong mCherry expression was only observed in budding or mature oocysts. Scale bar: 10 µm. (B) Oocyst numbers of infected midguts for trp1(-)mCh and wild-type parasites at day 12 and day 22 post-infection. * depicts p<0.05; one-way ANOVA followed by a Kruskal-Wallis test. Horizontal bars indicate the median. Data were generated from two (trp1(-)mCh) and three (fluo) different feeding experiments, respectively. (C) Percentages of sporulated and unsporulated oocysts in trp1(-)mCh and wild-type infected midguts at 12 and 22 days post infection. * depicts p<0.05; one-tailed Student's t-test. The mean and the SEM are shown. Data were generated from three different feeding experiments.

DOI: http://dx.doi.org/10.7554/eLife.19157.005

Figure 2.

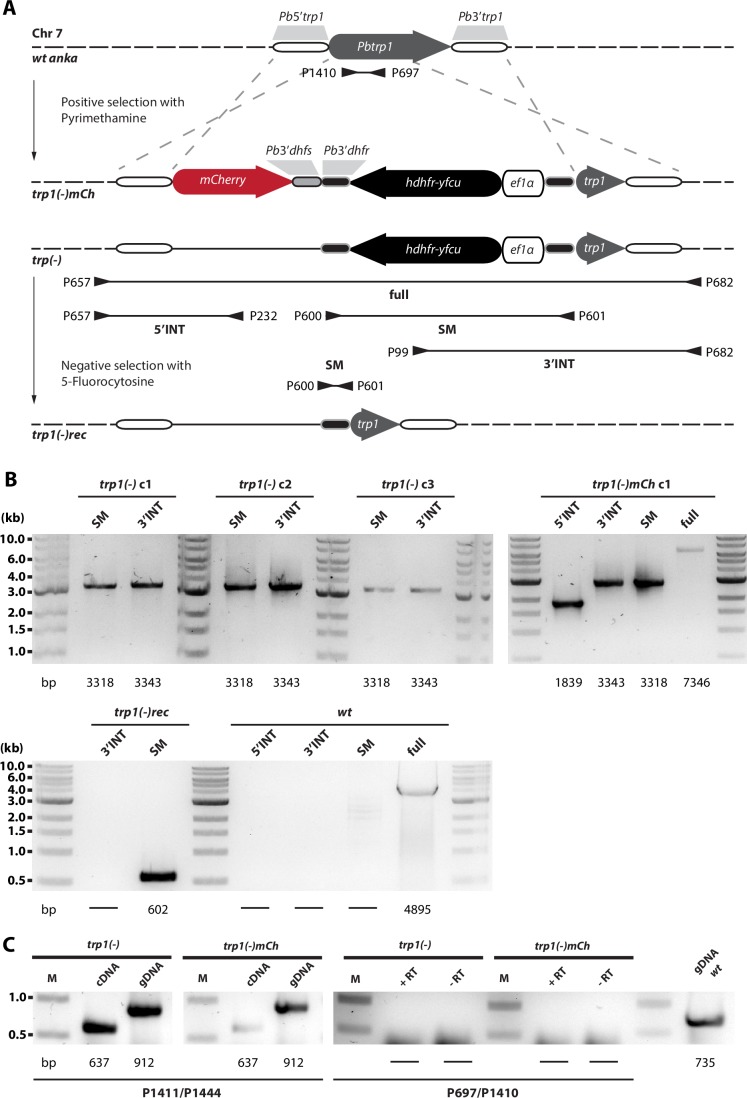
Figure 2—figure supplement 1. Generation and PCR analysis of trp1(-), trp1(-)mCh and trp1(-)rec parasites.

Figure 2—figure supplement 1.

(A) Schematic representation of the strategy for gene deletion and marker recycling via negative selection. Two different trp1(-) lines were generated by independent transfection of two different constructs into wild-type (wt) P. berghei strain ANKA parasites. The vector contained the positive-negative selection marker hdhfr-yfcu. The marker gene was flanked by ~1 kb sequences upstream and downstream of the open reading frame of trp1 to generate a knockout line by double crossover homologous recombination (trp1(-)). In addition, a second vector was generated to visualize trp1 promoter activity in vivo via expression of mCherry (trp1(-)mCh). Location of primers and the approximate length of the PCR fragments used for genotyping are indicated by arrows and lines below the scheme. (B) PCR analysis of clonal trp1(-) and trp1(-)mCh parasites. Note the shift in size of the complete locus (full) between trp1(-)mCh and wt. The expected sizes of the PCR products are indicated below. PCR analysis of negatively selected knockout parasites trp1(-)rec revealed loss of the selection cassette. Note the shift in size of the PCR product for the selection marker (SM) before and after negative selection. (C) RT-PCR with cDNA generated from trp1(-) and trp1(-)mCh midgut sporozoites. The PCR with the primers P1411/P1444 shows the presence of cDNA indicated by the loss of an intron and the shift in size of α-tubulin I. The PCR with the primers P697/P1410 is specific for trp1. An internal control with gDNA from the P. berghei ANKA strain is also shown to verify that the PCR worked. See also Figure 5.
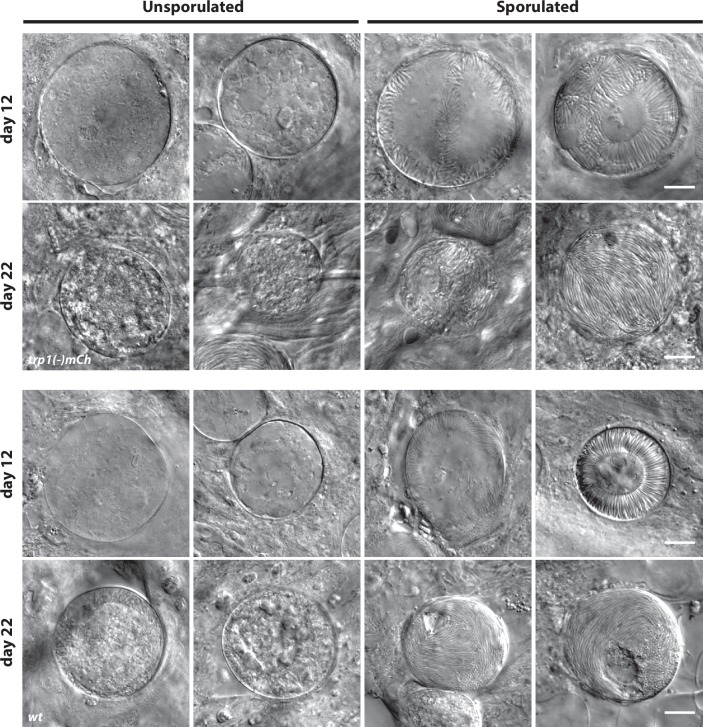
Figure 2—figure supplement 2. Classification of oocysts as unsporulated or sporulated.

Figure 2—figure supplement 2.

Examples of unsporulated and sporulated trp1(-)mCh and wt oocysts at day 12 and day 22. Note that oocysts with budding sporozoites as well as oocysts with completely developed sporozoites were classified as sporulated. Scale bar: 10 µm.
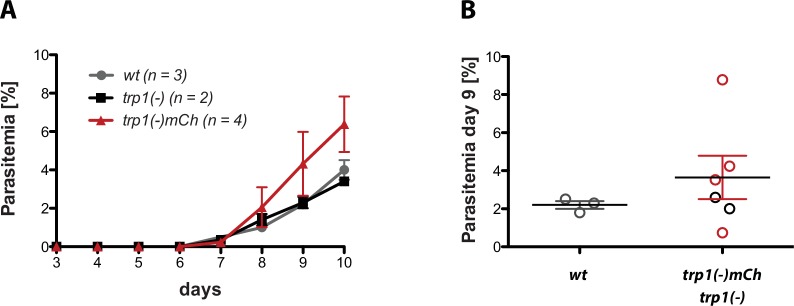
Figure 2—figure supplement 3. trp1(-) and trp(-)mCh midgut sporozoites are infective to mice if intravenously injected.

Figure 2—figure supplement 3.

(A) Midgut sporozoites of trp1(-) (400,000), wt (500,000) and trp1(-)mCh (500,000) were injected intravenously into four mice each. Parasitemia was monitored for 10 days post infection. Shown are the mean and SEM of four (trp1(-)mCh), two (trp1(-)) and three (wt) mice, which became blood-stage patent. (B) Parasitemia at day 9 post infection of the wt- and trp1(-)mCh-infected mice represented in (A).