
Fig. 1. Tectonic and induced earthquakes (M ≥ 3) in Oklahoma (1979 to September 2016).
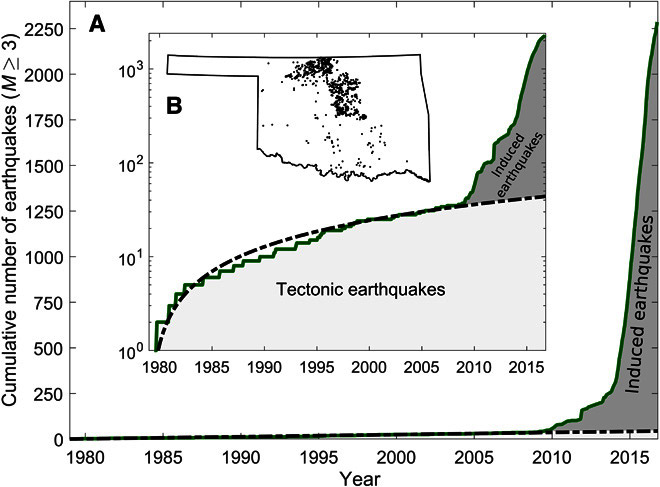
The cumulative number of earthquakes is presented in linear (A) and logarithmic scales (B). The map shows the epicenters of the earthquakes in Oklahoma. In 2009, the cumulative number of earthquakes (M ≥ 3) (green line) starts to exceed the constant tectonic earthquake activity (black dashed line). All earthquakes that are inconsistent with a constant tectonic background rate are classified as induced earthquakes (gray shaded area).