
Fig. 5. Annual magnitude exceedance probability and maximum magnitude in CO and WO.
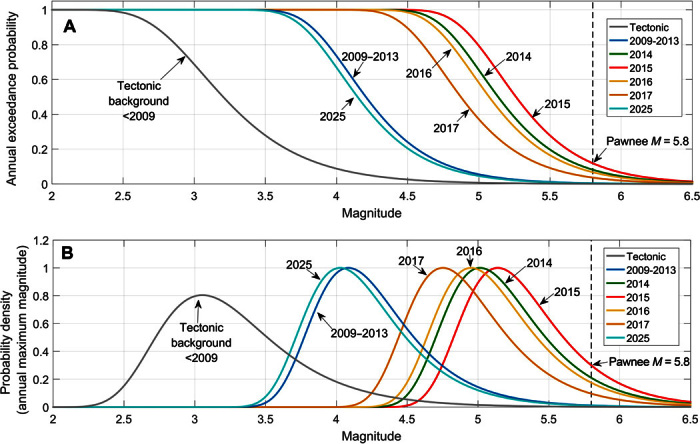
The figure shows combined annual probabilities of exceeding magnitude M (A) and the maximum magnitude (B) in the combined area of CO and WO. Magnitude exceedance probabilities have been computed according to Eq. 2 as well as assuming the applicability of Omori’s law to describe the decay of seismicity following injection. The probability of potentially damaging earthquakes is enhanced compared to the tectonic background and critically high in 2014 to 2016.